Weekly Statistics For The $SPT Token
Hello friends of $SPT, Friends of $HIVE and all others,
here are the:
$SPT Statistics for the last week:
The timeframe is from 2023-05-12 to 2023-05-19.
(There are small differences between the figures and the tables, because I used slightly different timeslots. I'm working on that.)
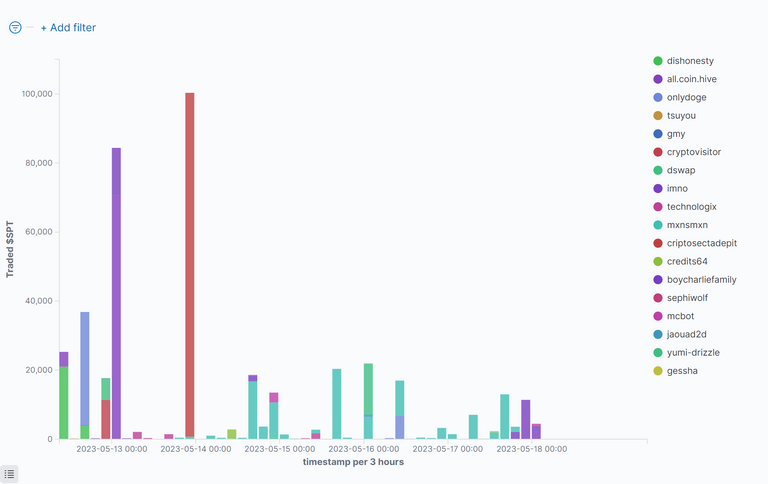
Bought $SPT By Time
This figure shows who has bought how many $SPT at which time:
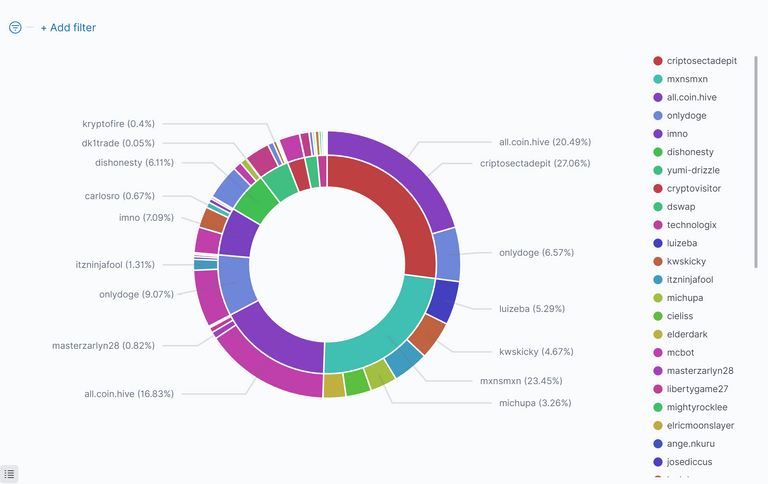
Top $SPT Buyers and $HIVE Sellers
The inside of the circle shows the buyers of $SPT, ordered by $HIVE they have spent. The outside shows the recipients of that $HIVE (sellers of $SPT):
Commulated Amount Of Bought $SPT Per Person
This figure shows the top 10 $SPT buyers, how much they got and how much $HIVE they spend for this. It is sorted by $HIVE, that was spent:
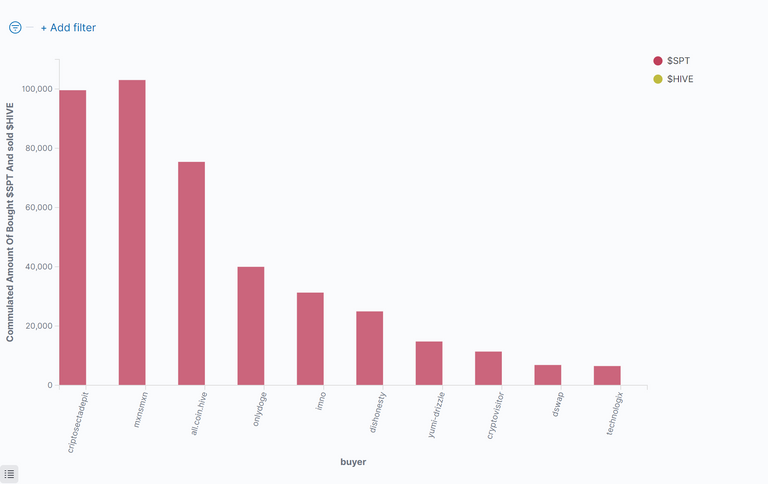
Table Of Top 20 $SPT Buyers
This table shows the top ten buyers of $SPT sorted by the $HIVE, they have spent:
| Buyer(Descending) | Sold $HIVE | % Sold $HIVE | Bought $SPT | Avg. Price | Number of Trades |
|---|---|---|---|---|---|
| @criptosectadepit | 72.69028 | 25.29 | 99590.44141 | 0.00073 | 3 |
| @mxnsmxn | 62.99158 | 21.92 | 103027.05160 | 0.00061 | 112 |
| @all.coin.hive | 45.22519 | 15.74 | 75400.44457 | 0.00060 | 14 |
| @imno | 30.76148 | 10.70 | 50788.61412 | 0.00061 | 16 |
| @onlydoge | 24.37658 | 8.48 | 39975.18331 | 0.00061 | 15 |
| @dishonesty | 16.42528 | 5.72 | 24931.17789 | 0.00063 | 10 |
| @yumi-drizzle | 12.05038 | 4.19 | 14768.14776 | 0.00081 | 14 |
| @cryptovisitor | 6.93536 | 2.41 | 11368.45758 | 0.00061 | 5 |
| @technologix | 5.11345 | 1.78 | 8484.53733 | 0.00060 | 22 |
| @dswap | 4.98504 | 1.73 | 6840.44052 | 0.00072 | 7 |
| @credits64 | 1.89864 | 0.66 | 2637.40039 | 0.00072 | 1 |
| @mcbot | 1.74070 | 0.61 | 2862.36090 | 0.00066 | 2 |
| @boycharliefamily | 1.19882 | 0.42 | 1665.27783 | 0.00072 | 1 |
| @jaouad2d | 0.46516 | 0.16 | 765.36169 | 0.00061 | 2 |
| @gessha | 0.26100 | 0.09 | 372.85715 | 0.00070 | 2 |
| @sephiwolf | 0.14375 | 0.05 | 199.67710 | 0.00072 | 2 |
| @tsuyou | 0.13600 | 0.05 | 200.00000 | 0.00068 | 1 |
| @gmy | 0.00000 | 0.00 | 0.00625 | 0.00064 | 2 |
| others | 0 | 0.00 | 0 | 0.00000 | 0 |
| Sum: | 287.39869 | 100% | 443877.43740 | 0.00070 | 231 |
Commulated Amount Of Sold $SPT Per Person
This figure shows the top 10 $SPT Sellers, how much they sold and how much $HIVE they got for this, sorted by $HIVE:
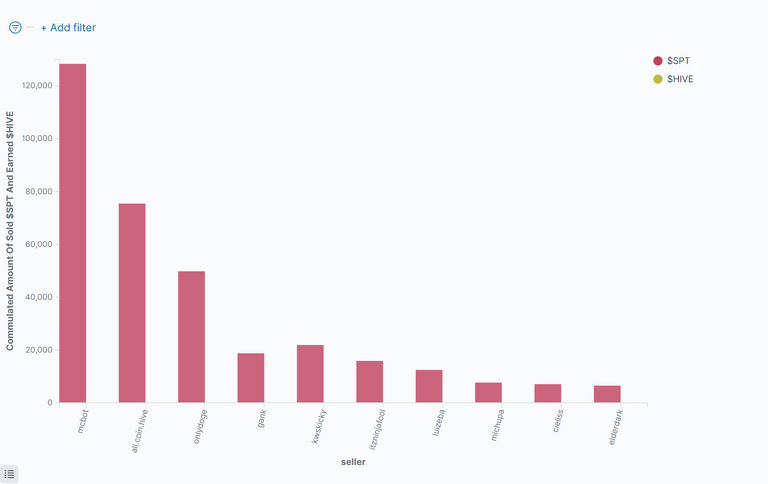
Table Of Top 20 $SPT Sellers
This table shows the top ten sellers of $SPT Sorted by the $HIVE, they have got:
| Seller(Descending) | Earned $HIVE | % Earned $HIVE | Sold $SPT | Avg. Price | Number of Trades |
|---|---|---|---|---|---|
| @mcbot | 77.43559 | 26.94 | 128310.88707 | 0.00060 | 11 |
| @all.coin.hive | 55.03327 | 19.15 | 75400.44141 | 0.00073 | 2 |
| @onlydoge | 35.24843 | 12.26 | 49775.20909 | 0.00072 | 8 |
| @gank | 14.27533 | 4.97 | 18713.05121 | 0.00081 | 8 |
| @kwskicky | 13.37488 | 4.65 | 21849.30127 | 0.00061 | 3 |
| @itzninjafool | 9.68714 | 3.37 | 15839.68945 | 0.00061 | 2 |
| @lenonmc21 | 8.34974 | 2.91 | 13922.03809 | 0.00060 | 1 |
| @luizeba | 7.51534 | 2.61 | 12424.67960 | 0.00060 | 3 |
| @michupa | 4.63824 | 1.61 | 7627.05615 | 0.00061 | 1 |
| @spt-shturm | 4.62308 | 1.61 | 7702.89919 | 0.00061 | 3 |
| @cieliss | 4.38643 | 1.53 | 7039.90967 | 0.00062 | 1 |
| @elderdark | 3.94917 | 1.37 | 6474.36768 | 0.00061 | 1 |
| @queen-silvia | 3.24570 | 1.13 | 5337.18726 | 0.00061 | 2 |
| @zallin.spt | 3.06789 | 1.07 | 5030.02197 | 0.00061 | 18 |
| @heutorybr | 3.02357 | 1.05 | 4897.26074 | 0.00062 | 1 |
| @libertygame27 | 2.79585 | 0.97 | 4645.76155 | 0.00060 | 4 |
| @danideuder | 2.42563 | 0.84 | 3928.78027 | 0.00062 | 1 |
| @masterzarlyn28 | 2.19602 | 0.76 | 3661.24561 | 0.00060 | 1 |
| @mawit07 | 2.10505 | 0.73 | 3437.44714 | 0.00061 | 3 |
| @furiousfighter | 2.08686 | 0.73 | 3380.83350 | 0.00062 | 2 |
| others | 27.93550 | 9.72 | 44479.36948 | 0.00063 | 155 |
| Sum: | 287.39871 | 100% | 443877.43740 | 0.00063 | 231 |
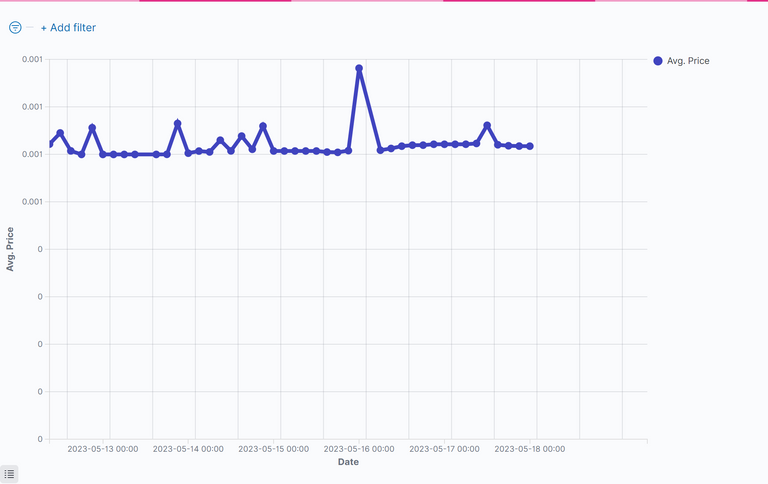
Price of the $SPT
This figure shows the price of $SPT for the last period:
$SPT Summarize Metrics
This table shows how much $HIVE was given by buy-requests, that where equal or higher than the sell order vs. sell-requests, that were equal or lower than the buy order.
If the buy-requests where higher than the sell-requests, then money comes into the system and the value of the token increases.
Under the total line one can see the sum of $HIVE and sum of $SPT that changed the ownership and the average price of $SPT for the last period.
| Request | Received Hive | Received HIVE % | Sold $SPT | Avg. Price |
|---|---|---|---|---|
| sell | 177.60536 | 61.80% | 292644.34221 | 0.00061 |
| buy | 109.79333 | 38.20% | 151233.09517 | 0.00072 |
| sum: | 287.39869 | 100% | 443877.43737999996 | 0.00067 |
Comparison With Other Tokens
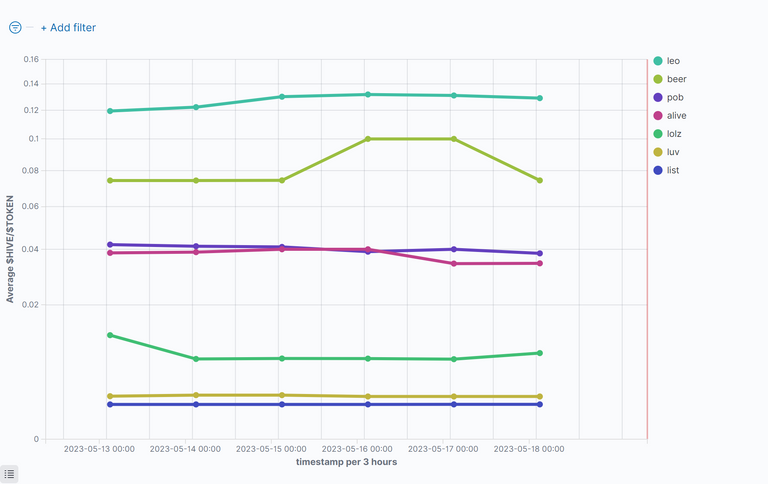
$HIVE/Token
This figure shows the value of $HIVE compared to some token for the last period. Be aware of the nonlinear (root square) y-axes.
US-Dollar/Token
This figure shows the value of $USD compared to some token for the last period. Be aware of the nonlinear (root square) y-axes.
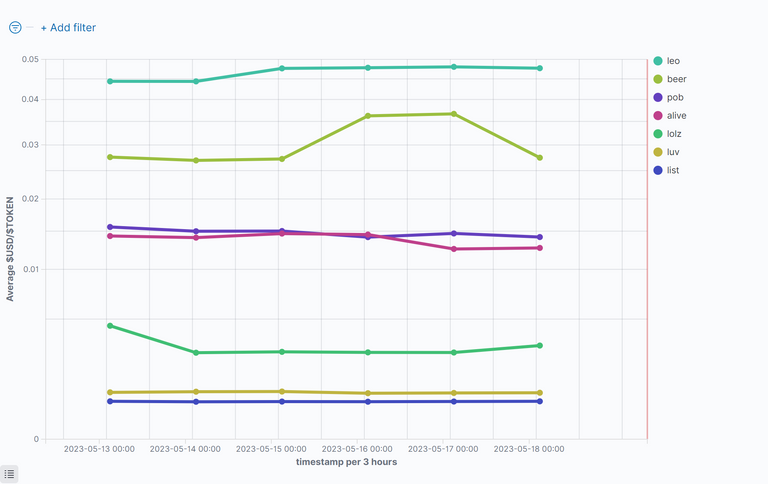
The HIVE rank in Coinmarktecap is: 156
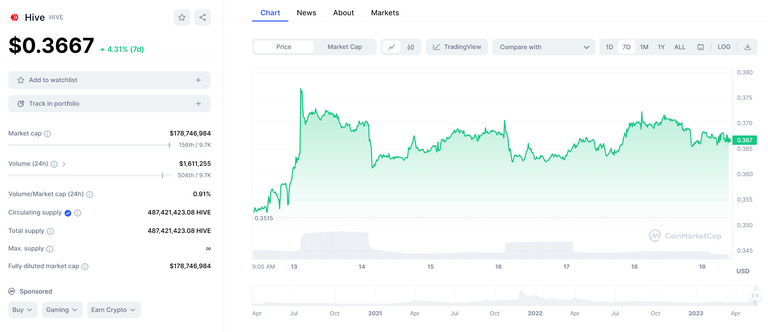
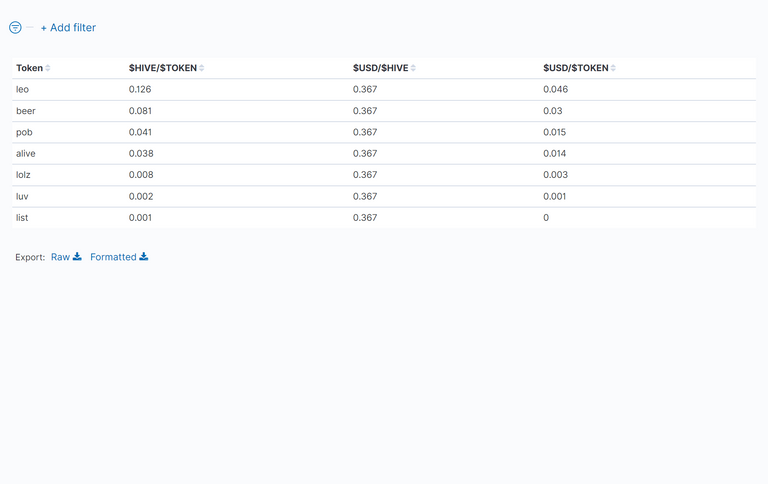
Table Of Token Prices in $HIVE and $USD
This table shows the average value of the prices of the token for the last period. One can see Hive and the US-Dollar compared to the token.
Disclaimer
All stats are without warranty.
They are taken from:
curl -XPOST -H "Content-type: application/json" -d '{ "jsonrpc": "2.0", "method": "find", "params": { "contract": "market", "table": "tradesHistory", "query": { "symbol": "TOKEN"}, "limit":1000, "offset": 0 }, "id": 1 }' 'https://api.hive-engine.com/rpc/contracts'
I have put them into logfiles and uploaded them to Kibana, from which I took the screenshots.
If you find errors, please tell me!
If you want me to continue the stats, give me some good upvotes ;-)
If you want to see other statistics (even from totaly other data), please contact me. I can create them weekly or monthly if I get some rewards for it.
For more details see here: How I Have Set Up Elasticsearch And Kibana On My Raspberry Pi To Monitor Token Activities and here: Do You Want To See Statistics Of Your Favorite HIVE Token? or on github.
Here are the stats from the other tokens I observe: https://peakd.com/@achimmertens/posts?filter=stats
Regards, Achim Mertens
thanks for the DATA !WINE
Congratulations, @imno You Successfully Shared 0.100 WINEX With @achimmertens.
You Earned 0.100 WINEX As Curation Reward.
You Utilized 1/4 Successful Calls.
Contact Us : WINEX Token Discord Channel
WINEX Current Market Price : 0.200
Swap Your Hive <=> Swap.Hive With Industry Lowest Fee (0.1%) : Click This Link
Read Latest Updates Or Contact Us