Weekly Statistics For The $SPT Token
Hello friends of $SPT, Friends of $HIVE and all others,
here are the:
$SPT Statistics for the last 2 weeks:
The timeframe is from 2023-05-19 to 2023-06-02.
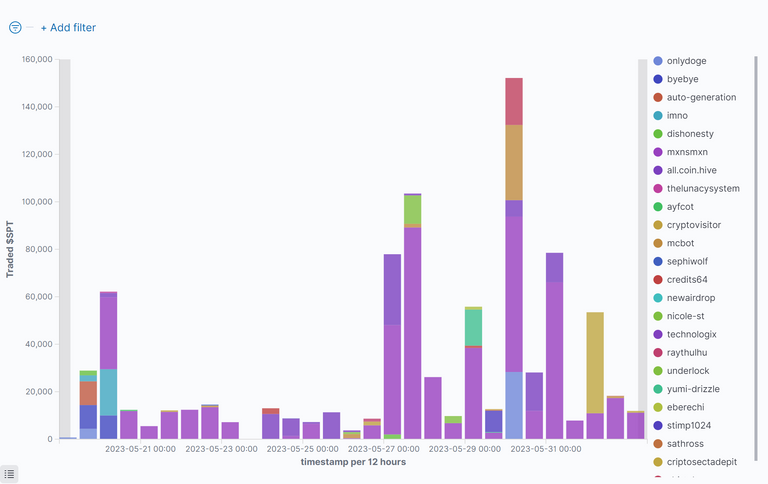
Bought $SPT By Time
This figure shows who has bought how many $SPT at which time:
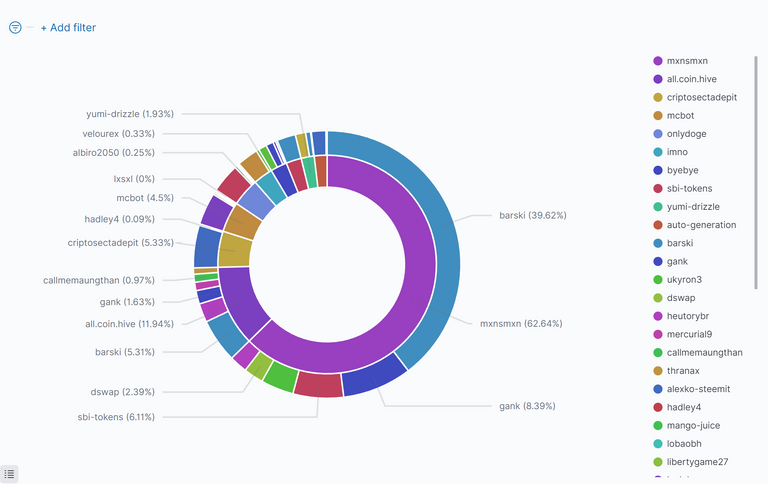
Top $SPT Buyers and $HIVE Sellers
The inside of the circle shows the buyers of $SPT, ordered by $HIVE they have spent. The outside shows the recipients of that $HIVE (sellers of $SPT):
Commulated Amount Of Bought $SPT Per Person
This figure shows the top 10 $SPT buyers, how much they got and how much $HIVE they spend for this. It is sorted by $HIVE, that was spent:
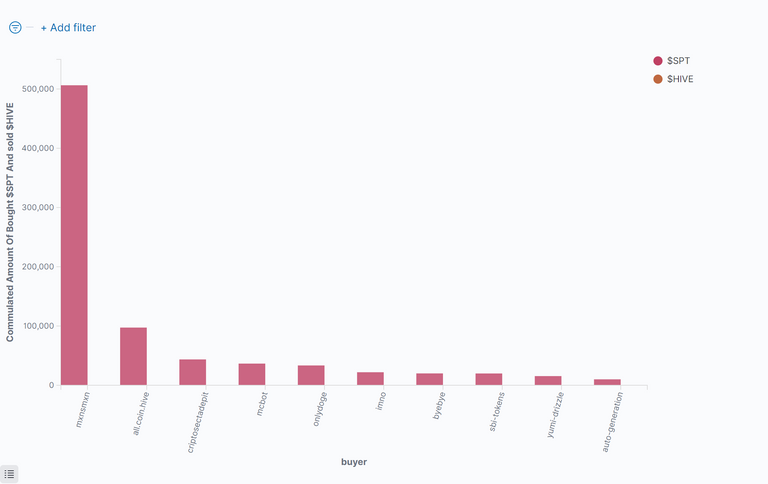
Table Of Top 20 $SPT Buyers
This table shows the top ten buyers of $SPT sorted by the $HIVE, they have spent:
| Buyer(Descending) | Sold $HIVE | % Sold $HIVE | Bought $SPT | Avg. Price | Number of Trades |
|---|---|---|---|---|---|
| @mxnsmxn | 362.60525 | 59.54 % | 506297.36844 | 0.00072 | 323 |
| @all.coin.hive | 69.13639 | 11.35 % | 97340.15862 | 0.00072 | 60 |
| @criptosectadepit | 30.83774 | 5.06 % | 43597.28921 | 0.00072 | 7 |
| @mcbot | 26.06083 | 4.28 % | 36560.70727 | 0.00074 | 7 |
| @onlydoge | 23.92417 | 3.93 % | 33367.47770 | 0.00075 | 17 |
| @imno | 16.78820 | 2.76 % | 21999.99896 | 0.00076 | 3 |
| @byebye | 14.14510 | 2.32 % | 20000.00024 | 0.00069 | 8 |
| @sbi-tokens | 13.12558 | 2.16 % | 19887.24511 | 0.00066 | 2 |
| @yumi-drizzle | 11.16934 | 1.83 % | 15472.83041 | 0.00074 | 5 |
| @auto-generation | 10.98887 | 1.80 % | 9999.99979 | 0.00103 | 6 |
| @nicole-st | 9.17725 | 1.51 % | 12746.17551 | 0.00072 | 7 |
| @stimp1024 | 6.43500 | 1.06 % | 9000.00020 | 0.00071 | 16 |
| @dishonesty | 2.99802 | 0.49 % | 4000.00009 | 0.00076 | 9 |
| @credits64 | 2.69443 | 0.44 % | 3361.68734 | 0.00075 | 6 |
| @underlock | 2.14095 | 0.35 % | 2999.99993 | 0.00071 | 2 |
| @cryptovisitor | 1.74614 | 0.29 % | 2231.00052 | 0.00076 | 8 |
| @raythulhu | 1.08958 | 0.18 % | 1226.46555 | 0.00089 | 2 |
| @technologix | 1.08009 | 0.18 % | 1500.00000 | 0.00072 | 5 |
| @eberechi | 1.00000 | 0.16 % | 1223.96341 | 0.00081 | 3 |
| @thelunacysystem | 0.64608 | 0.11 % | 846.54571 | 0.00076 | 7 |
| others | 1.18578 | 0.19 % | 1363.42254 | 0.00116 | 6 |
| Sum: | 608.97479 | 100 % | 845022.33655 | 0.00081 | 509 |
Commulated Amount Of Sold $SPT Per Person
This figure shows the top 10 $SPT Sellers, how much they sold and how much $HIVE they got for this, sorted by $HIVE:
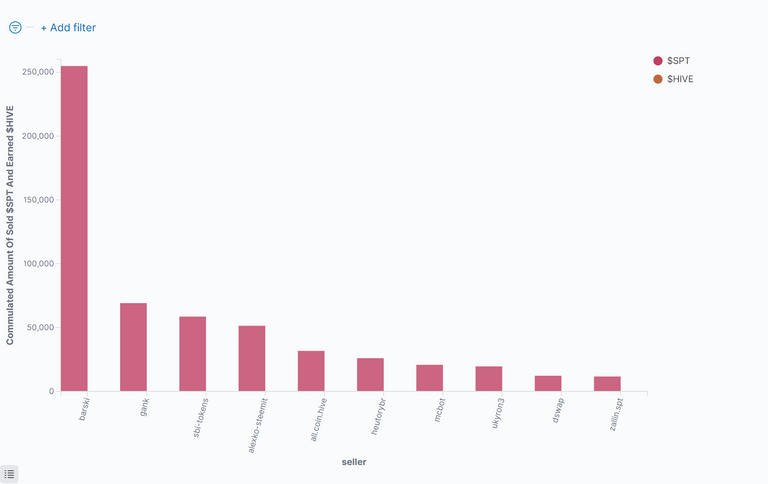
Table Of Top 20 $SPT Sellers
This table shows the top ten sellers of $SPT Sorted by the $HIVE, they have got:
| Seller(Descending) | Earned $HIVE | % Earned $HIVE | Sold $SPT | Avg. Price | Number of Trades |
|---|---|---|---|---|---|
| @barski | 181.40832 | 29.79 % | 254785.53697 | 0.00072 | 35 |
| @gank | 49.18945 | 8.08 % | 69081.01403 | 0.00070 | 14 |
| @sbi-tokens | 41.47412 | 6.81 % | 58523.89844 | 0.00071 | 4 |
| @alexko-steemit | 39.92615 | 6.56 % | 51350.68506 | 0.00080 | 4 |
| @all.coin.hive | 22.44210 | 3.69 % | 31666.12500 | 0.00071 | 1 |
| @heutorybr | 17.77355 | 2.92 % | 25982.13226 | 0.00070 | 3 |
| @mcbot | 15.82485 | 2.60 % | 20759.75821 | 0.00074 | 7 |
| @ukyron3 | 13.99402 | 2.30 % | 19525.32617 | 0.00072 | 2 |
| @dswap | 8.66126 | 1.42 % | 12208.66065 | 0.00072 | 12 |
| @zallin.spt | 8.42893 | 1.38 % | 11618.47407 | 0.00072 | 40 |
| @crazyphantombr | 8.17769 | 1.34 % | 11155.78202 | 0.00072 | 8 |
| @javivisan | 8.12465 | 1.33 % | 11216.20908 | 0.00072 | 6 |
| @velourex | 7.69450 | 1.26 % | 10079.14893 | 0.00076 | 2 |
| @tedus | 7.20000 | 1.18 % | 10000.00000 | 0.00072 | 1 |
| @queenstarr | 7.15291 | 1.17 % | 9909.39709 | 0.00072 | 2 |
| @yonilkar | 6.94158 | 1.14 % | 9929.73047 | 0.00070 | 1 |
| @mango-juice | 6.81918 | 1.12 % | 9628.16469 | 0.00071 | 7 |
| @burlarj | 6.78152 | 1.11 % | 9184.44336 | 0.00074 | 1 |
| @mawit07 | 6.66707 | 1.09 % | 9244.66119 | 0.00072 | 9 |
| @casimirio | 6.60359 | 1.08 % | 9419.30664 | 0.00070 | 1 |
| others | 137.68936 | 22.61 % | 189753.88217 | 0.00073 | 349 |
| Sum: | 608.97480 | 100 % | 845022.33650 | 0.00073 | 509 |
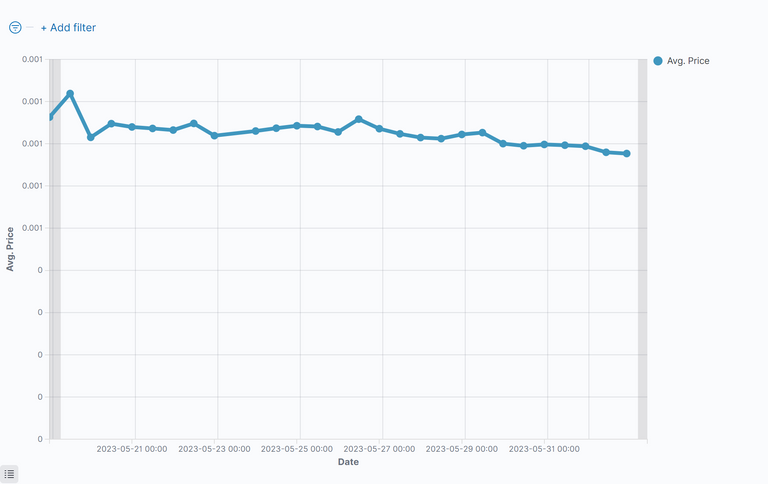
Price of the $SPT
This figure shows the price of $SPT for the last period:
$SPT Summarize Metrics
This table shows how much $HIVE was given by buy-requests, that where equal or higher than the sell order vs. sell-requests, that were equal or lower than the buy order.
If the buy-requests where higher than the sell-requests, then money comes into the system and the value of the token increases.
Under the total line one can see the sum of $HIVE and sum of $SPT that changed the ownership and the average price of $SPT for the last period.
| Request | Received Hive | Received HIVE % | Sold $SPT | Avg. Price |
|---|---|---|---|---|
| sell | 517.97692 | 85.06% | 722969.18607 | 0.00072 |
| buy | 90.99788 | 14.94% | 122053.15046 | 0.00081 |
| sum: | 608.9748 | 100% | 845022.3365300001 | 0.00077 |
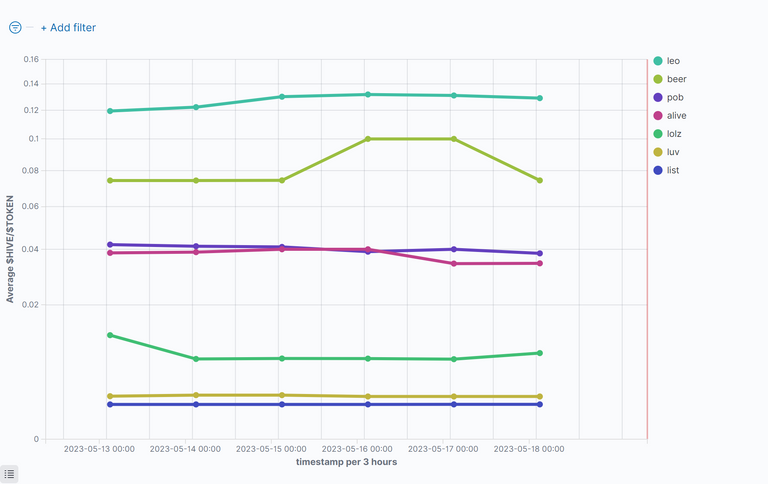
Comparison With Other Tokens
$HIVE/Token
This figure shows the value of $HIVE compared to some token for the last period. Be aware of the nonlinear (root square) y-axes.
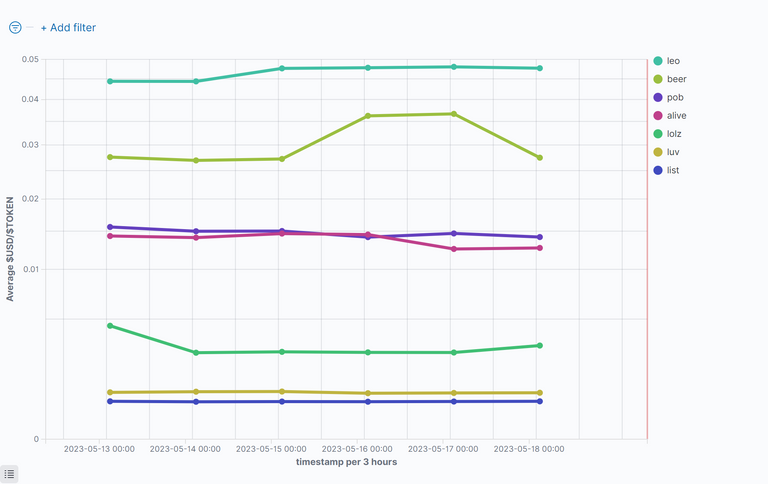
US-Dollar/Token
This figure shows the value of $USD compared to some token for the last period. Be aware of the nonlinear (root square) y-axes.
The HIVE rank in Coinmarktecap is: 165
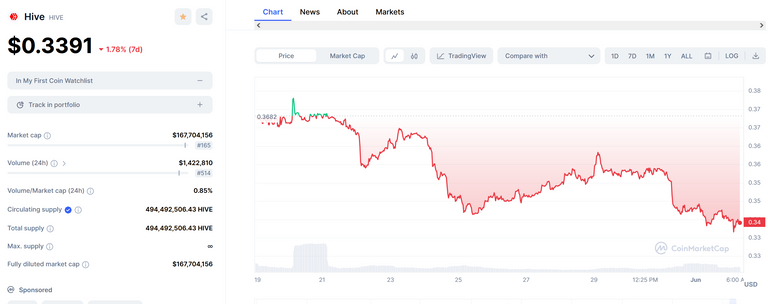
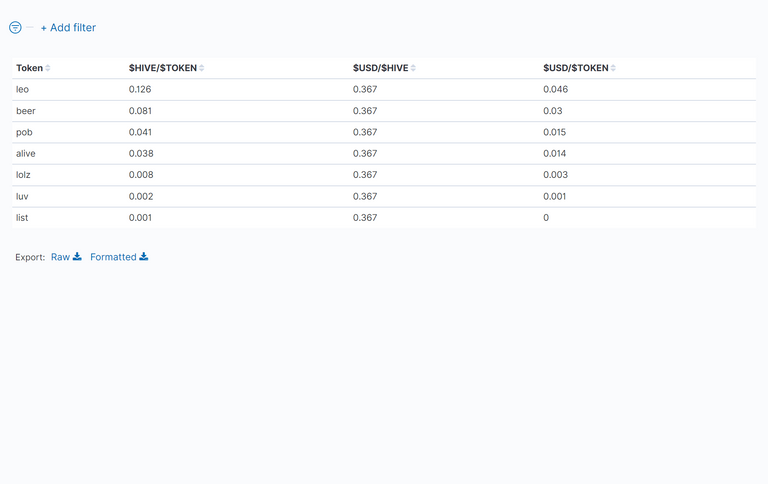
Table Of Token Prices in $HIVE and $USD
This table shows the average value of the prices of the token for the last period. One can see Hive and the US-Dollar compared to the token.
Disclaimer
All stats are without warranty.
They are taken from:
curl -XPOST -H "Content-type: application/json" -d '{ "jsonrpc": "2.0", "method": "find", "params": { "contract": "market", "table": "tradesHistory", "query": { "symbol": "TOKEN"}, "limit":1000, "offset": 0 }, "id": 1 }' 'https://api.hive-engine.com/rpc/contracts'
I have put them into logfiles and uploaded them to Kibana, from which I took the screenshots.
If you find errors, please tell me!
If you want me to continue the stats, give me some good upvotes ;-)
If you want to see other statistics (even from totaly other data), please contact me. I can create them weekly or monthly if I get some rewards for it.
For more details see here: How I Have Set Up Elasticsearch And Kibana On My Raspberry Pi To Monitor Token Activities and here: Do You Want To See Statistics Of Your Favorite HIVE Token? or on github.
Here are the stats from the other tokens I observe: https://peakd.com/@achimmertens/posts?filter=stats
Regards, Achim Mertens
!PIZZA
$PIZZA slices delivered:
@tedus(1/5) tipped @achimmertens