3 Unique Ways to Use Tradingview Charts
If you're like me, 99% of the time you're using Tradingview, you pull up a Crypto/BTC or Crypto/USDT chart and analyze the price history looking for a trade or just watching the price go up to all-time highs, but the site has so much more to offer.
Tracking Altcoin Dominance
Tradingview makes it easy to track Bitcoin Dominance, but have you ever wanted to track Altcoin dominance? It's not that hard to set-up and all you have to do is follow these steps.
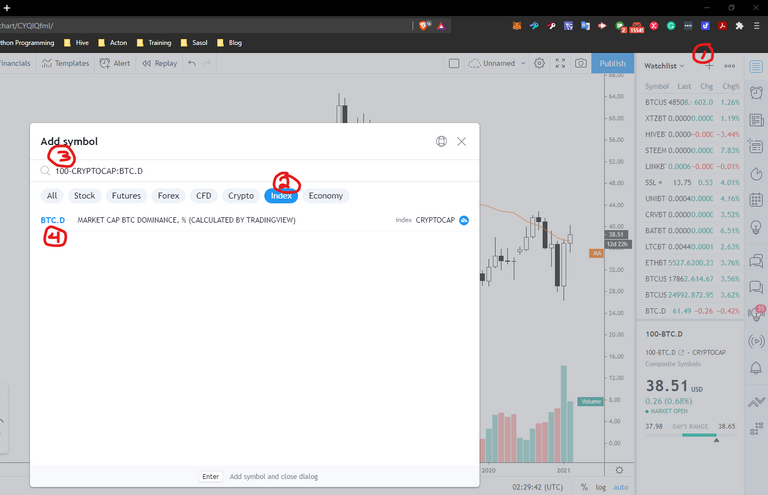
- Click the plus next to the watchlist
- Click on Index
- Type 100- in the search bar
- Click on BTC.D so your final formula should look like "100-CRYPTOCAP:BTC.D"
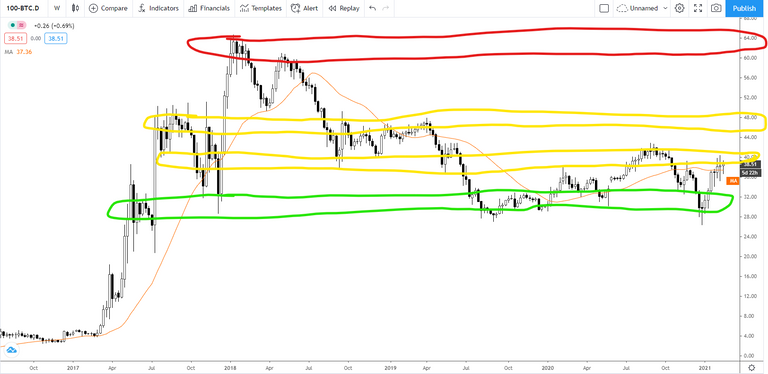
As you can see from the image below the numbers on the right should be read as percentages, so currently the altcoin dominance is at almost 39% or Bitcoin dominance is just over 61% (100-61=39).
How to Use This Information?
Since the last bull market, when Altcoin dominance has dropped below 30%, it's a good time to buy some altcoins. When Altcoin dominance crosses 40% and 48%, it's a decent time to reduce your Altcoin exposure and accumulate some Bitcoin or some Stablecoins. Anything above 60% we're entering uncharted territory and all bets are off if you should get completely out of Altcoins or ride the wave to new all-time highs.
If this alt-cycle plays out similar to the last cycle we're still a ways away from reaching peak euphoric alt season assuming we're going to get to or blow past 64% Altcoin dominance. Even with Altcoins breaking new all-time highs every day from a USDT standpoint, most outside of DeFi, are still lagging or just barely catching up from a BTC standpoint.
Comparing Coins
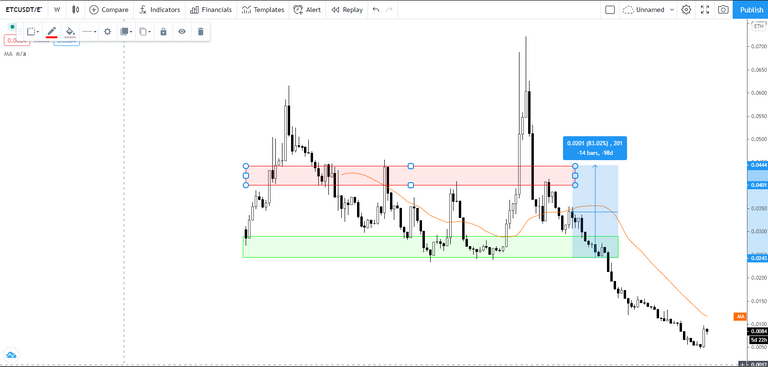
For almost 2 years you could have made some pretty good money by buying Ethereum Classic and then back into Ethereum once the ETC/ETH ratio reached a certain point. As always, this worked really well until it didn't, but adds a new way to evaluate a trade rather than just trading back and forth from Crypto to Stablecoin or Bitcoin to Altcoins.
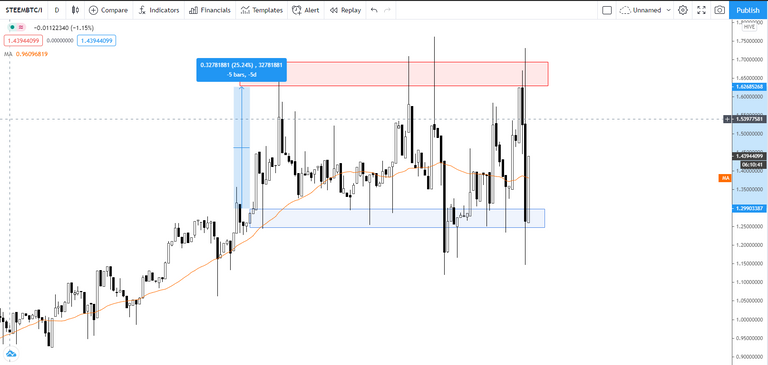
Another chart I'm going to start watching is the Hive/Steem chart just for kicks and giggles. I have this chart set up as a SteemBTC/HiveBTC ratio so anytime the number is less than 1 the value of the Hive price is higher, greater than one Steem is the price is higher and equal to 1 1 Hive = 1 Steem. If the ratio ever reaches 1.7 again, I'll probably sell some more Steem for Hive, and then convert back to Steem at around 1.25 and see how long I can keep doing that. The end goal would be to collect more Hive or sell for more Sats.
Tracking the Current Value of Your Portfolio
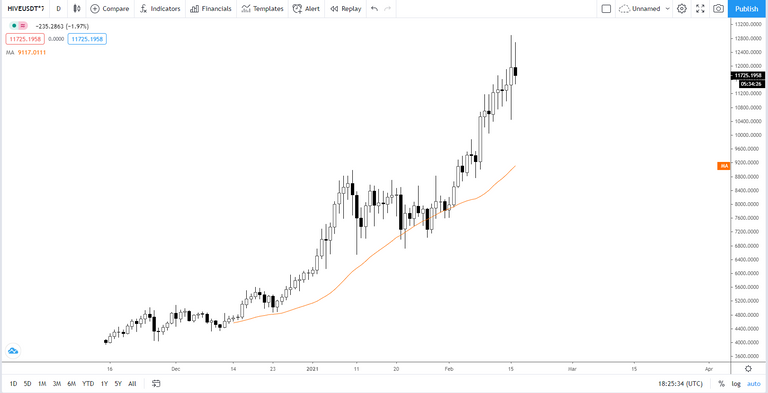
Now there are much better ways to track your portfolios such as Blockfolio or something similar, but you can use Tradingview to track the value of your crypto for coins that you have locked away for long-term holding. Below is a sample of one of my portfolios.
In USDT
If you want to create something similar here is how you would set it up.
- (number of Bitcoins you have)*BTCUSDT = Dollar amount of Bitcoin you own
- (Number of Leo you have)WLEOWETHETHUSDT = Dollar amount of LEO you own
- If you own stable coins you can just add the number of stable coins you own at the end (assuming it's a US Dollar stable coin or you can use (Number of stable coins)*USDCUSD.
- (number of Bitcoins you have)BTCUSDT+(Number of Leo you have)WLEOWETH*ETHUSDT+(Number of Hive you have)+HiveUSDT = Dollar amount total you own of Bitcoin, Leo, and Hive.
The formula I used to create the above chart is
BINANCE:HIVEUSDT7029 + UNISWAP:WLEOWETHBINANCE:ETHUSDT1400 + 0.12BINANCE:BTCUSDT + 1.2842BINANCE:ETHUSDT + 300KRAKEN:USDCUSD + 477.76BINANCE:XLMUSDT + 145BINANCE:BATUSDT+0.2455*BINANCE:LTCUSDT
Note This only tracks the past value of your current portfolio. For example, if I put a buy-in for 1 Bitcoin in Blockfolio, it only tracks the 1 Bitcoin addition from today going forward. If I were to add 1 Bitcoin to the above formula, it would add that 1 Bitcoin to the previous value as well as everything going forward.
In Hive
You can also use this approach to see how much crypto is currently worth in Hive. For example, if you owned 1 Bitcoin and 10 Ethereum you could use the following formulas to track how many Hive that would have been worth on a given day.
- 1*BTCUSDT/HIVEUSDT
- 10*ETHUSDT/HIVEUSDT
- 1BTCUSDT/HIVEUSDT + 10ETHUSDT/HIVEUSDT
Note You don't have to use a USDT base you can easily use a BTC base (bottom or second value) as well, but the important thing is you keep them the same for both values. For example
1BTCUSDT/HIVEUSDT + 10ETHBTC/HIVEBTC should give me the same number of Hive because I kept the base the same for BTC and HIVE and ETH and HIVE. This is important in case something doesn't have a BTC base or a USDT Base.
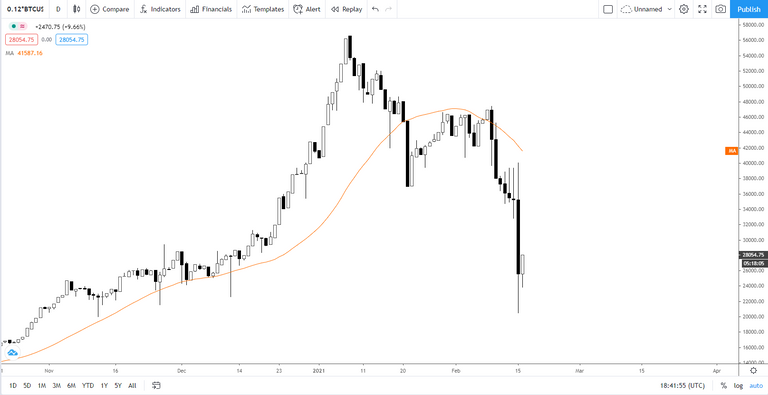
This is a "good" way to look at Hive when the price is not going up as compared to everything else because it just means you can buy that much more Hive with your current crypto holdings. It's a good psychological fake out as looking at this chart with the current price spike, makes me wish I would have sold more Bitcoin at the beginning of the year for Hive.
A Little Extra Math
As can be seen above, if you're wanting to use a Uniswap coin that has an ETH-based pair you can make it work with a little extra math.
We'll use WLEO as an example
The only native chart on Tradingview is WLEOWETH. If you wanted to check the price of WLEO in terms of Bitcoin you would use the formula WLEOWETH*ETHBTC and that would give you WLEOBTC or Wrapped Leo per Bitcoin. Basically, it would give you the Bitcoin price of a single Wrapped Leo, which is what you would normally see looking at Bitcoin base pairs on a centralized exchange.
Please let me know in the comments below if you found this useful and I'll make some more articles like this on Tradingview sharing tips and tricks for using the site or something similar. If you know of a similar site that you like using let me know that as well. Always looking for better alternatives to Tradingview
Posted Using LeoFinance Beta
Yikes! You're way smarter than I am! This is a really great post with lots of information. I'm totally going to mess around with tradingview using your instructions here. I just need to find a couple hours of quiet time where I'll be able to think it all through. Super informative! Thank you!
Posted Using LeoFinance Beta
No problem, I have a hard time explaining things sometimes, so if something doesn't make sense, isn't working, or you can't get it to chart the way you think it should, let me know and I'll see if I can help you out.
I should also say I don't know about way smarter, just learned somethings along the way by watching and learning from others, the same thing you're doing right now.
https://twitter.com/GnikSivart/status/1361756802665254915
Thanks for this.
Posted Using LeoFinance Beta
You're welcome.
Very insightful and glad you used WLEO as an example as this is exactly something I have been wanting to get involved with. P.S that math meme never gets old lol
Posted Using LeoFinance Beta
Yeah I was just playing around the other day and started playing around with it and checking to see if it worked how I thought it should. I've been wanting to track WLeo price on there and not sure what took me so long to think of it like that.
Good stuff. I am in tradingview everyday, these are good tips.
Posted Using LeoFinance Beta
Yeah I need to spend more time in there just haven't had the time this bull run. Thanks for stopping by.
Very interesting blogpost. I use Tradingview a lot and have not taken advantage of these functions. I am now intrigued and will definitely look at it from a different perspective. Thanks @gniksivart.
Posted Using LeoFinance Beta
Thank you. Learne so much from this post. These Ratio Trends reminds me on the Gold-Silver Ratio Chart, Now the GSR is about 66 (it cost 66 ounces of silver to buy 1 ounce of gold), that means silver is compared to gold very cheap, and that means it is good to accumulate silver. The Ratio should be 15, as the physical deposit on earth is 15 silver to 1 gold, the ratio was 115 last year and silver was f***ing cheap compared to gold, if the ratio dropping to or below 30 it is time to swap silver for gold.
Thank you
Posted Using LeoFinance Beta
Wow such a great post full of nuggets !
Udon tradingview for stocks mostly but nothing complex, just combining some TA indicators. Your tips will definitely help me to up my game, thanks a lot.
Posted Using LeoFinance Beta
awesome article!
Posted Using LeoFinance Beta
Thank you really cool guide!