PeakMonsters Market Trends: data viz tweaks to improve this powerful tool!
@peakmonsters is a market and website for trading cards for the @splinterlands game. It's available at https://peakmonsters.com and supports Hive Keychain, such that you don't have to do anything reckless with your private keys to use it!
One of my favorite features is MARKET TRENDS, which shows the price history of any card. For example, check out the market trends for Lensmaster, a legendary 1-mana monster of the Life splinter:
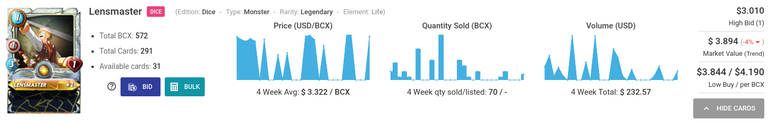
You'll notice the markets trends are split into three visualizations:
- Price (USD/BCX)
- Quantity Sold (BCX)
- Volume (USD)
BCX stands for Base Card eXperience and refers to the number of entry level cards. As someone who's been doing data science for over a decade now, I thought I'd share a few ideas on how to improve these plots.
Price: This plot is a filled area chart, which is the right approach. However, on days where there are no purchases, the price value should be undefined / NA / missing / null rather than $0.00. For zero-volume days, no point should be plotted and the trend line should continue straight through. Therefore the price won't look like it's dropping to zero, when actually there has been no change in the price or market.
Quantity Sold: this graph is perfect! A barplot is the right way to visualize this data. Zero-volume days show up cleanly.
Volume: This plot should be switched to a barplot like the Quantity Sold plot. Doing so will make the blue-shaded area exactly proportional to the number of cards (BCX) sold.
Other PeakMonsters Notes
As a side note, I'm part of the PeakMonsters PREMIERE guild. We've got some fierce players in this guild. PeakMonsters also hosts lower-level guilds if you're looking for a guild. But first, make sure you use the PeakMonsters market for purchases, as that is a prerequisite.
Using PeakMonsters can save money using their bid system, kickbacks, and availability of cards paying below 5% market fees.
Also I recently learned about their BULK buy option to get an exact number of BCX for as cheap as possible:
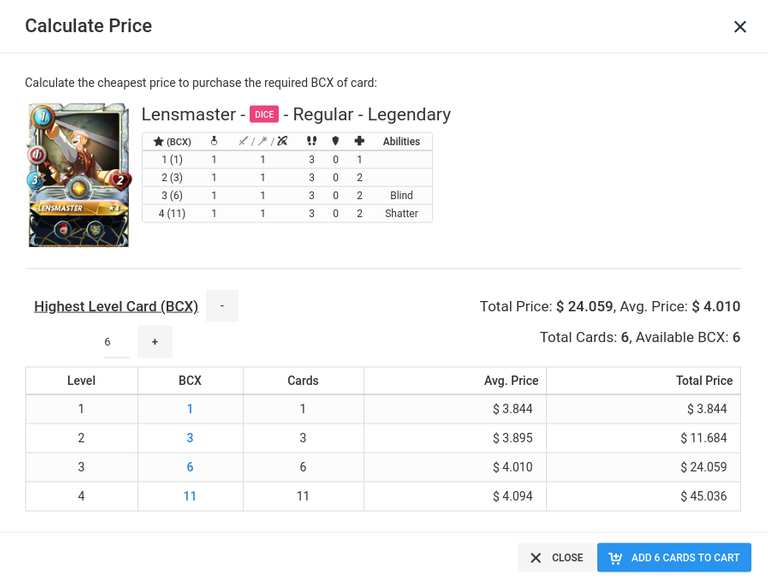 .
.
The historical data for individual cards is something that is missing ib the game. Peakmonsters have basicly build their own database for this.
Love your sugestions... same price when there is no sales, and barchart for the volume!
Thanks! I want to clarify since "same price when there is no sales" sounds to me like filling the missing price values with the last market price. I was thinking something slightly different, which was to not have a price point at all.
For example, imagine the following price data:
Currently, Day 2 will be plotted with a price of $0. Under your proposal (as I understand it), Day 2 will be plotted with a price of $5 (filled from Day 1). Under my proposal, Day 2 will not be plotted, in that there will be no point drawn for it. The line would still go through Day 2 at $4, as it decreases from $5 to $3. But there wouldn't be a point at $4, so its clear that no sales occurred and the slope reflects a multi day price change.
@dalz does that make sense? Either way would be a big improvement over $0.
Oh, so you are suggesting connecting the dots between the sales, but with empty dot so to speak to indicate there is no sale. That might be better, cause otherwise we will see this spikes when a trade occurs, rather than a line chart.
Yes. Imagine the current price plot above if you deleted the zero-sale points. The line would then connect the closest days with sale.
Rather than draw an empty dot (a circle with a white interior), I think you can just omit the point entirely. Whether there is a point would be a bit more clear if the point size were increased.
Yeah, if you fill prices with the last-sale price, you'd get more of a plot that looked like it had steps. I sometime use "step" plots, but it really depends on what we think is the most accurate reflection of the data.
Nice suggestions. Thanks for sharing.
I will have to look into splinterlands here soon. Feel a bit like I missed the boat on it and am late at this point though. Have you looked into dCity yet?
I haven't looked at dCity. From a time and resource perspective, I'm not to keen to adopt an additional NFT hobby. Although glad to see the Hive chain being used for other games.
I wouldn't say you've missed the boat, especially if the @splinterland team continues to grow the game. In the same way no one has missed the boat on Bitcoin. We're still in the early days. I think a smart player and investor could wait till the card prices were low (not the current moment) and then buy in with a powerful collection for cheaper than most of the veterans.
You pay a premium if you want the cards right when they first get released. You'd have the luxury of avoiding this premium.
Some exciting news. @peakmonsters just updated their market trends plots (see announcement post). Thanks @asgarth and @jarvie for implementing this so quickly.
Here's what the Lensmaster market trends visualization looks like now:
Congratulations @dhimmel! You have completed the following achievement on the Hive blockchain and have been rewarded with new badge(s) :
You can view your badges on your board and compare yourself to others in the Ranking
If you no longer want to receive notifications, reply to this comment with the word
STOPI am very motivated with you, for your constant positive evaluations of my publications. Thank you. God will always be with you. Hugs from Venezuela. Success for you is my sincere wish this Christmas.
Hey @dhimmel ,
Sorry to jump in with something a bit off-topic.
Do you mind having a look at the Hivebuzz proposal we made for 2021 and why not casting your vote on it so that our team can continue with its work of gamifying Hive and motivating users?
https://peakd.com/me/proposals/147
Have a Happy New Year ✨🥂✨
Excelent
The market trends for Splinterlands is currently up up up up :)
!BEER
@dhimmel do u think if i am good on binance trading, I should try splinterlands as buy low, sell high? As my some cards 6x. Plz give your advice on this.
Hi @dhimmel
Are you still active on Hive?
~ Chris Rice
Open Source : D.Buzz
As needed... what's up?
Thank you @dhimmel . . we published a Hive Proposal to Open source https://d.buzz and I think it's worth it.
Can you kindly consider reviewing it?
https://peakd.com/me/proposals/263
Posted via D.Buzz
Thank you for the time you already gave me by replying.
Posted via D.Buzz