Weekly Statistics For The $SPT Token
Hello friends of $SPT, Friends of $HIVE and all others,
here are the:
$SPT Statistics for the last week:
The timeframe is from 2023-07-21 to 2023-07-28.
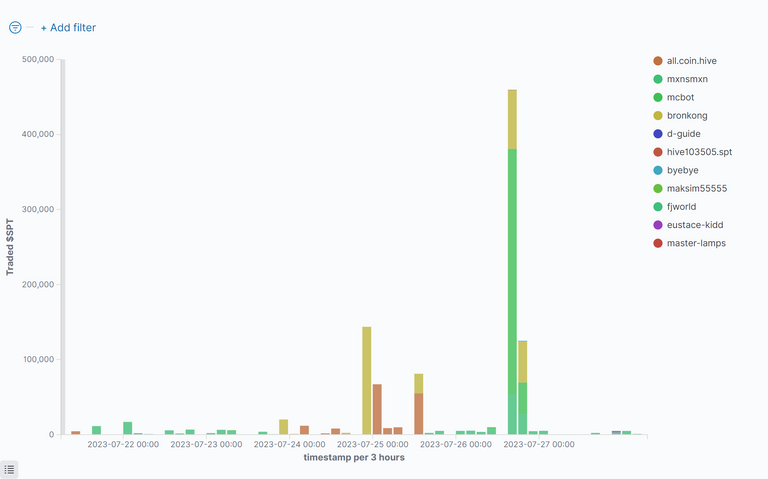
Bought $SPT By Time
This figure shows who has bought how many $SPT at which time:
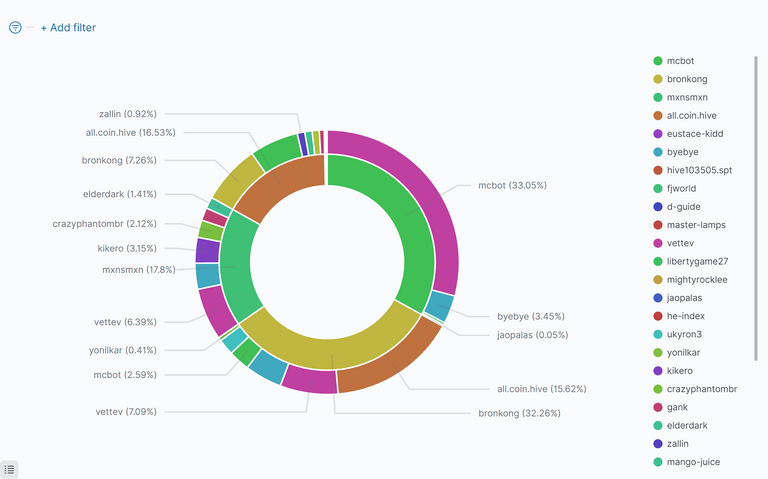
Top $SPT Buyers and $HIVE Sellers
The inside of the circle shows the buyers of $SPT, ordered by $HIVE they have spent. The outside shows the recipients of that $HIVE (sellers of $SPT):
Commulated Amount Of Bought $SPT Per Person
This figure shows the top 10 $SPT buyers, how much they got and how much $HIVE they spend for this. It is sorted by $HIVE, that was spent:
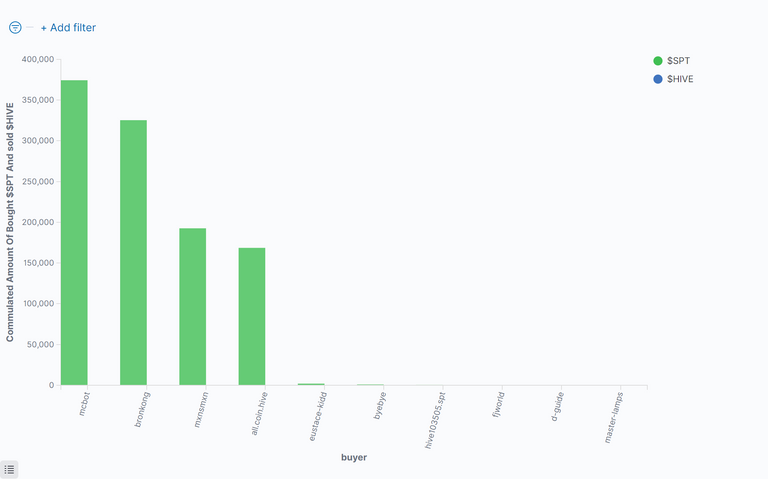
Table Of Top 20 $SPT Buyers
This table shows the top ten buyers of $SPT sorted by the $HIVE, they have spent:
| Buyer(Descending) | Sold $HIVE | % Sold $HIVE | Bought $SPT | Avg. Price | Number of Trades |
|---|---|---|---|---|---|
| @mcbot | 185.65010 | 33.05 % | 374384.38163 | 0.00053 | 13 |
| @bronkong | 181.18265 | 32.26 % | 325366.76334 | 0.00056 | 26 |
| @mxnsmxn | 99.97604 | 17.80 % | 192642.92883 | 0.00053 | 139 |
| @all.coin.hive | 92.83423 | 16.53 % | 168637.85608 | 0.00055 | 47 |
| @eustace-kidd | 0.98598 | 0.18 % | 2000.00000 | 0.00049 | 1 |
| @byebye | 0.49692 | 0.09 % | 1000.04236 | 0.00050 | 2 |
| @hive103505.spt | 0.34200 | 0.06 % | 543.80663 | 0.00063 | 2 |
| @fjworld | 0.12369 | 0.02 % | 250.00001 | 0.00049 | 2 |
| @d-guide | 0.05260 | 0.01 % | 84.84369 | 0.00062 | 3 |
| @master-lamps | 0.01266 | 0.00 % | 25.90585 | 0.00049 | 2 |
| @maksim55555 | 0.00141 | 0.00 % | 2.55232 | 0.00056 | 2 |
| others | 0 | 0.00 % | 0 | 0.00000 | 0 |
| Sum: | 561.65828 | 100 % | 1064939.08074 | 0.00059 | 239 |
Commulated Amount Of Sold $SPT Per Person
This figure shows the top 10 $SPT Sellers, how much they sold and how much $HIVE they got for this, sorted by $HIVE:
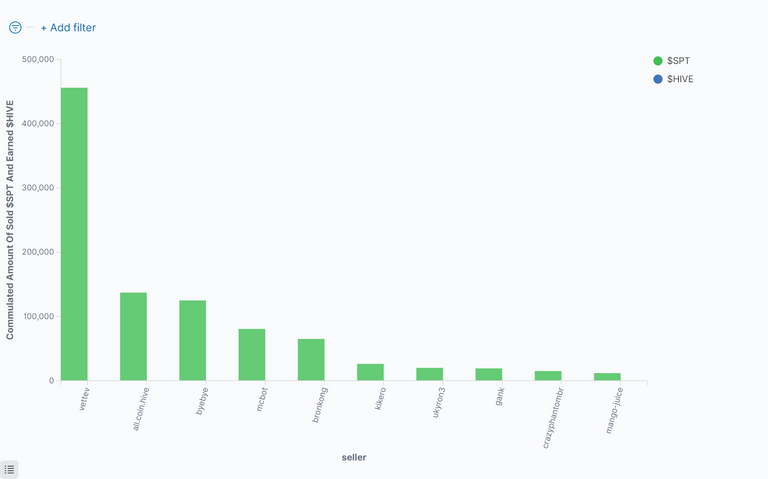
Table Of Top 20 $SPT Sellers
This table shows the top ten sellers of $SPT Sorted by the $HIVE, they have got:
| Seller(Descending) | Earned $HIVE | % Earned $HIVE | Sold $SPT | Avg. Price | Number of Trades |
|---|---|---|---|---|---|
| @vettev | 228.15996 | 40.62 % | 455849.87964 | 0.00050 | 9 |
| @all.coin.hive | 86.21457 | 15.35 % | 137076.97949 | 0.00063 | 2 |
| @byebye | 57.61499 | 10.26 % | 124897.96761 | 0.00047 | 9 |
| @mcbot | 44.34242 | 7.89 % | 80598.82687 | 0.00054 | 7 |
| @bronkong | 35.75325 | 6.37 % | 65000.00000 | 0.00055 | 1 |
| @kikero | 14.67791 | 2.61 % | 26153.72339 | 0.00056 | 4 |
| @ukyron3 | 11.00000 | 1.96 % | 20000.00000 | 0.00055 | 1 |
| @gank | 10.14499 | 1.81 % | 19130.92279 | 0.00052 | 7 |
| @crazyphantombr | 8.46159 | 1.51 % | 15022.64355 | 0.00056 | 2 |
| @mango-juice | 6.40465 | 1.14 % | 11755.02480 | 0.00055 | 4 |
| @elderdark | 5.60483 | 1.00 % | 10735.01538 | 0.00052 | 3 |
| @zallin.spt | 4.86945 | 0.87 % | 9173.40998 | 0.00053 | 36 |
| @zallin | 4.53442 | 0.81 % | 8243.65039 | 0.00055 | 1 |
| @mvl2304 | 4.29148 | 0.76 % | 7801.98242 | 0.00055 | 1 |
| @blrog | 2.68418 | 0.48 % | 5034.82119 | 0.00054 | 3 |
| @libertygame27 | 2.66683 | 0.47 % | 5131.08633 | 0.00051 | 4 |
| @danideuder | 2.54450 | 0.45 % | 4491.06152 | 0.00057 | 1 |
| @mawit07 | 2.50413 | 0.45 % | 5087.94189 | 0.00049 | 1 |
| @mightyrocklee | 2.29358 | 0.41 % | 4271.91650 | 0.00053 | 6 |
| @yonilkar | 2.27447 | 0.40 % | 3790.78589 | 0.00060 | 1 |
| others | 24.61611 | 4.38 % | 45691.44113 | 0.00055 | 136 |
| Sum: | 561.65831 | 100 % | 1064939.08076 | 0.00055 | 239 |
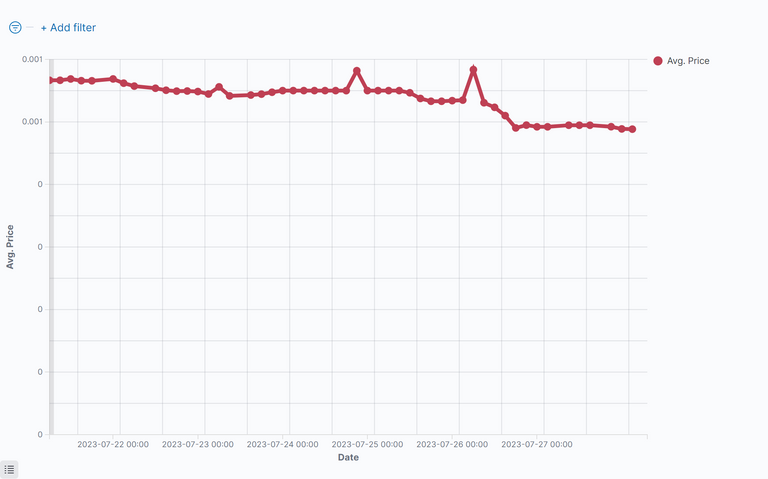
Price of the $SPT
This figure shows the price of $SPT for the last period:
$SPT Summarize Metrics
This table shows how much $HIVE was given by buy-requests, that where equal or higher than the sell order vs. sell-requests, that were equal or lower than the buy order.
If the buy-requests where higher than the sell-requests, then money comes into the system and the value of the token increases.
Under the total line one can see the sum of $HIVE and sum of $SPT that changed the ownership and the average price of $SPT for the last period.
| Request | Received Hive | Received HIVE % | Sold $SPT | Avg. Price |
|---|---|---|---|---|
| buy | 300.02751 | 53.42% | 567449.77623 | 0.00055 |
| sell | 261.63077 | 46.58% | 497489.30451 | 0.00053 |
| sum: | 561.65828 | 100% | 1064939.08074 | 0.00054 |
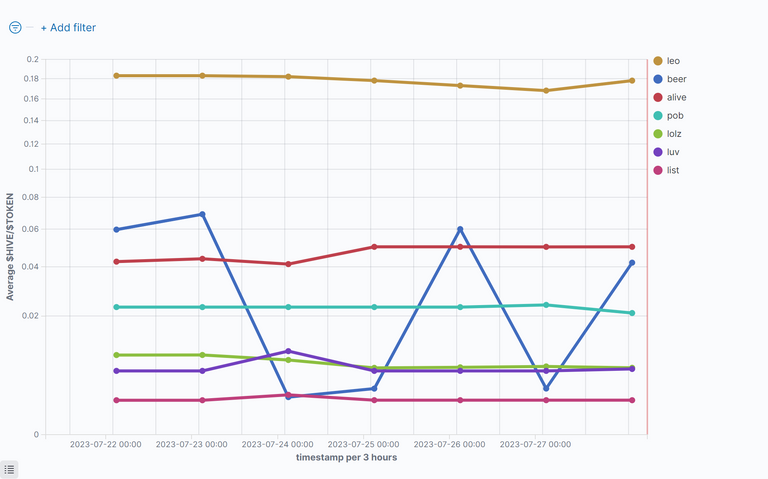
Comparison With Other Tokens
$HIVE/Token
This figure shows the value of $HIVE compared to some token for the last period. Be aware of the nonlinear (root square) y-axes.
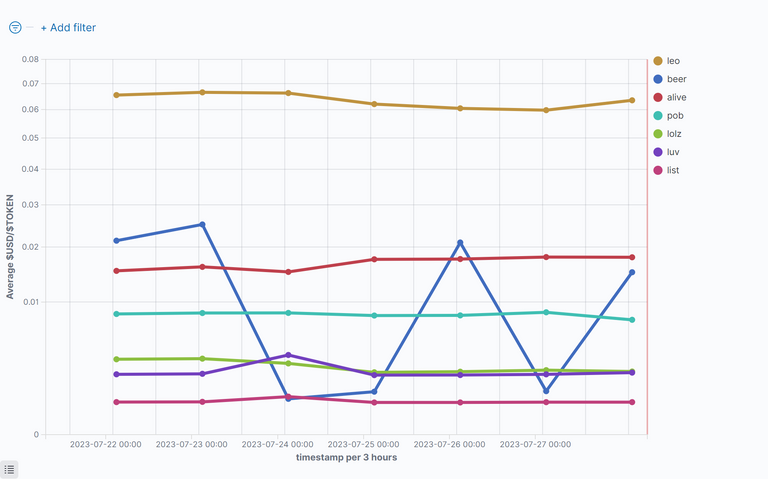
US-Dollar/Token
This figure shows the value of $USD compared to some token for the last period. Be aware of the nonlinear (root square) y-axes.
The HIVE rank in Coinmarktecap is: 148
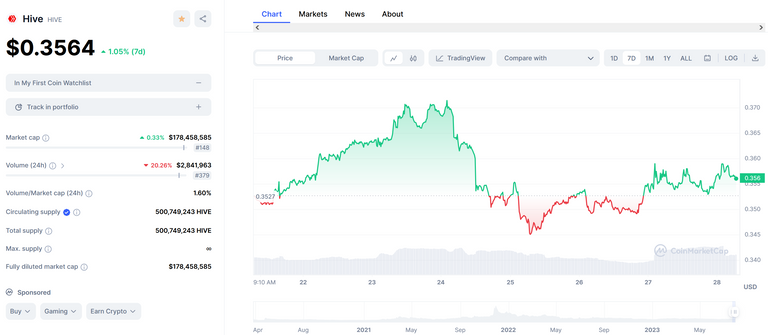
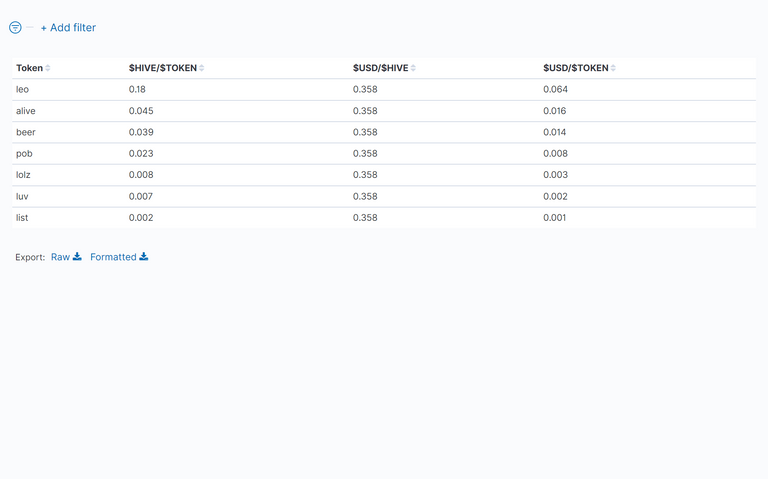
Table Of Token Prices in $HIVE and $USD
This table shows the average value of the prices of the token for the last period. One can see Hive and the US-Dollar compared to the token.
Disclaimer
All stats are without warranty.
They are taken from:
curl -XPOST -H "Content-type: application/json" -d '{ "jsonrpc": "2.0", "method": "find", "params": { "contract": "market", "table": "tradesHistory", "query": { "symbol": "TOKEN"}, "limit":1000, "offset": 0 }, "id": 1 }' 'https://api.hive-engine.com/rpc/contracts'
I have put them into logfiles and uploaded them to Kibana, from which I took the screenshots.
If you find errors, please tell me!
If you want me to continue the stats, give me some good upvotes ;-)
If you want to see other statistics (even from totaly other data), please contact me. I can create them weekly or monthly if I get some rewards for it.
For more details see here: How I Have Set Up Elasticsearch And Kibana On My Raspberry Pi To Monitor Token Activities and here: Do You Want To See Statistics Of Your Favorite HIVE Token? or on github.
Here are the stats from the other tokens I observe: https://peakd.com/@achimmertens/posts?filter=stats
Regards, Achim Mertens
Thank you for sharing this data regarding HIVE's second level tokens