Weekly Statistics For The $SPT Token
Hello friends of $SPT, Friends of $HIVE and all others,
here are the:
$SPT Statistics For The Last Week:
The timeframe is from 2023-08-11 to 2023-08-18.
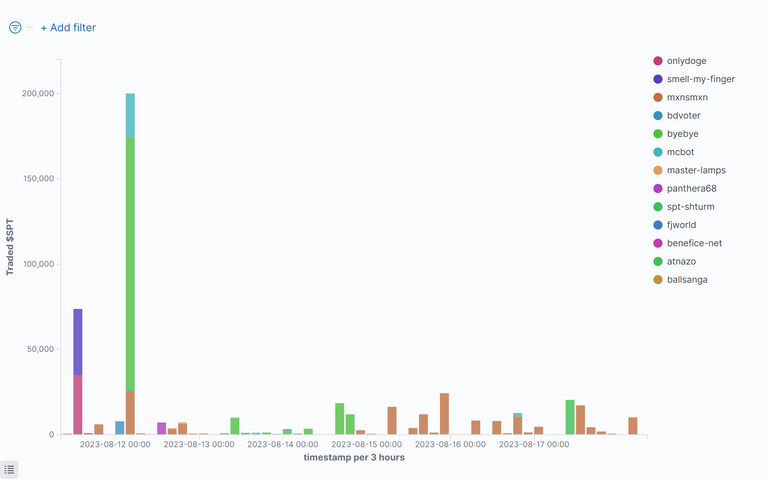
Bought $SPT By Time
This figure shows who has bought how many $SPT at which time:
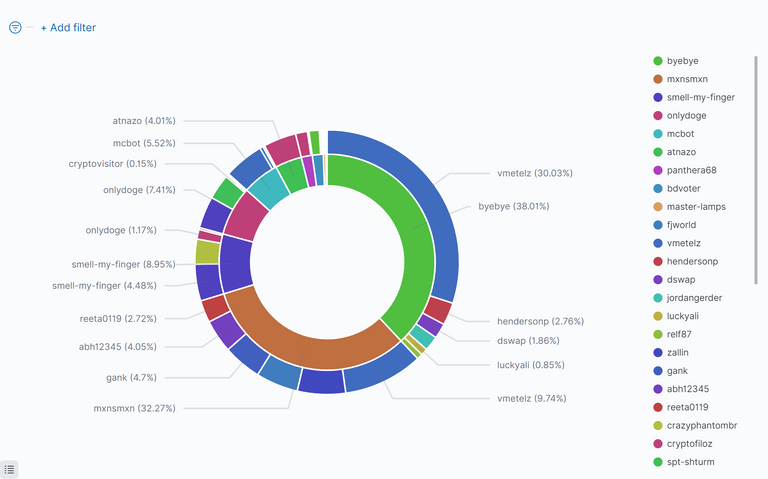
Top $SPT Buyers And $HIVE Sellers
The inside of the circle shows the buyers of $SPT, ordered by $HIVE they have spent. The outside shows the recipients of that $HIVE (sellers of $SPT):
Commulated Amount Of Bought $SPT Per Person
This figure shows the top 10 $SPT buyers, how much they got and how much $HIVE they spend for this. It is sorted by $HIVE, that was spent:
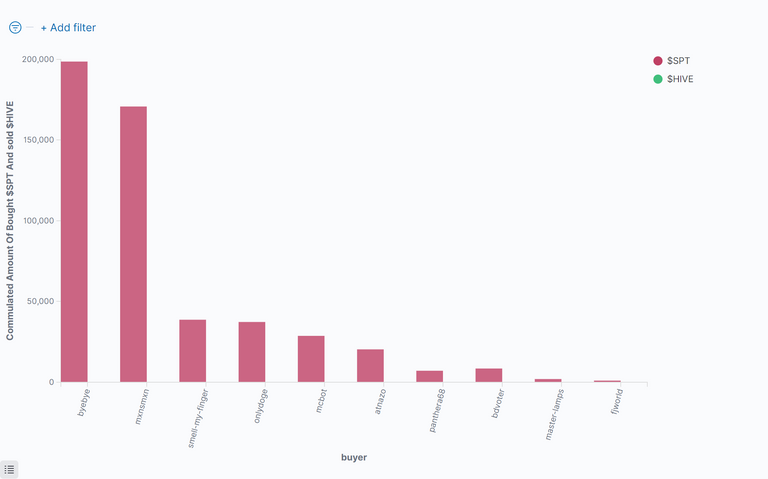
Table Of Top 20 $SPT Buyers
This table shows the top ten buyers of $SPT sorted by the $HIVE, they have spent:
| Buyer(Descending) | Sold $HIVE | % Sold $HIVE | Bought $SPT | Avg. Price | Number of Trades |
|---|---|---|---|---|---|
| @byebye | 90.32251 | 37.99 % | 198640.23448 | 0.00045 | 47 |
| @mxnsmxn | 76.68486 | 32.25 % | 170803.38549 | 0.00045 | 107 |
| @smell-my-finger | 21.26798 | 8.94 % | 38713.35962 | 0.00054 | 4 |
| @onlydoge | 17.60104 | 7.40 % | 37314.84702 | 0.00047 | 23 |
| @mcbot | 13.12640 | 5.52 % | 28715.13012 | 0.00050 | 7 |
| @atnazo | 9.51847 | 4.00 % | 20349.91797 | 0.00047 | 1 |
| @panthera68 | 3.90806 | 1.64 % | 7106.61587 | 0.00055 | 6 |
| @bdvoter | 3.88864 | 1.64 % | 8490.48620 | 0.00046 | 6 |
| @master-lamps | 0.88973 | 0.37 % | 1967.64283 | 0.00045 | 14 |
| @fjworld | 0.45125 | 0.19 % | 1000.00048 | 0.00045 | 7 |
| @benefice-net | 0.09794 | 0.04 % | 182.05589 | 0.00054 | 1 |
| @spt-shturm | 0.00445 | 0.00 % | 8.23535 | 0.00054 | 2 |
| @ballsanga | 0.00280 | 0.00 % | 5.90100 | 0.00047 | 1 |
| others | 0 | 0.00 % | 0 | 0.00000 | 0 |
| Sum: | 237.76413 | 100 % | 513297.81232 | 0.00053 | 226 |
Commulated Amount Of Sold $SPT Per Person
This figure shows the top 10 $SPT Sellers, how much they sold and how much $HIVE they got for this, sorted by $HIVE:
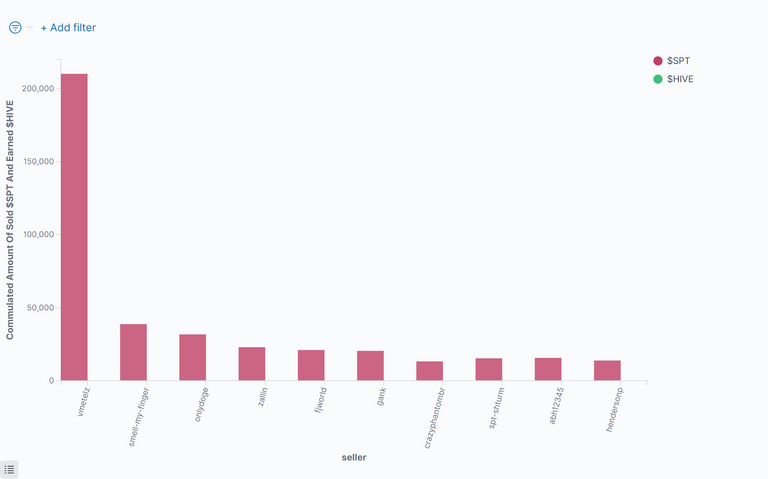
Table Of Top 20 $SPT Sellers
This table shows the top ten sellers of $SPT Sorted by the $HIVE, they have got:
| Seller(Descending) | Earned $HIVE | % Earned $HIVE | Sold $SPT | Avg. Price | Number of Trades |
|---|---|---|---|---|---|
| @vmetelz | 95.91532 | 40.34 % | 210099.99615 | 0.00046 | 7 |
| @smell-my-finger | 19.78417 | 8.32 % | 38730.98047 | 0.00051 | 2 |
| @onlydoge | 15.75941 | 6.63 % | 31698.72852 | 0.00052 | 3 |
| @zallin | 9.82057 | 4.13 % | 22946.87842 | 0.00043 | 3 |
| @fjworld | 9.59926 | 4.04 % | 21013.08777 | 0.00046 | 6 |
| @gank | 9.25704 | 3.89 % | 20421.51349 | 0.00045 | 5 |
| @crazyphantombr | 7.26698 | 3.06 % | 13214.36914 | 0.00055 | 1 |
| @spt-shturm | 7.22880 | 3.04 % | 15325.31250 | 0.00047 | 1 |
| @abh12345 | 6.74672 | 2.84 % | 15615.64453 | 0.00043 | 2 |
| @hendersonp | 6.22907 | 2.62 % | 13811.67969 | 0.00045 | 1 |
| @dswap | 4.83196 | 2.03 % | 10704.41764 | 0.00045 | 8 |
| @reeta0119 | 4.53597 | 1.91 % | 10192.03495 | 0.00045 | 2 |
| @jordangerder | 4.08651 | 1.72 % | 9060.99512 | 0.00045 | 1 |
| @luckyali | 3.47609 | 1.46 % | 7687.56494 | 0.00045 | 2 |
| @elderdark | 3.21073 | 1.35 % | 6969.40039 | 0.00046 | 1 |
| @felipejoys | 2.97097 | 1.25 % | 6486.83203 | 0.00046 | 1 |
| @stickupcash | 2.87693 | 1.21 % | 6366.71838 | 0.00045 | 2 |
| @mango-juice | 2.71649 | 1.14 % | 5962.69263 | 0.00045 | 5 |
| @zallin.spt | 2.64712 | 1.11 % | 5820.08300 | 0.00045 | 36 |
| @javivisan | 2.34343 | 0.99 % | 5166.16797 | 0.00045 | 1 |
| others | 16.46058 | 6.92 % | 36002.71453 | 0.00047 | 136 |
| Sum: | 237.76412 | 100 % | 513297.81226 | 0.00047 | 226 |
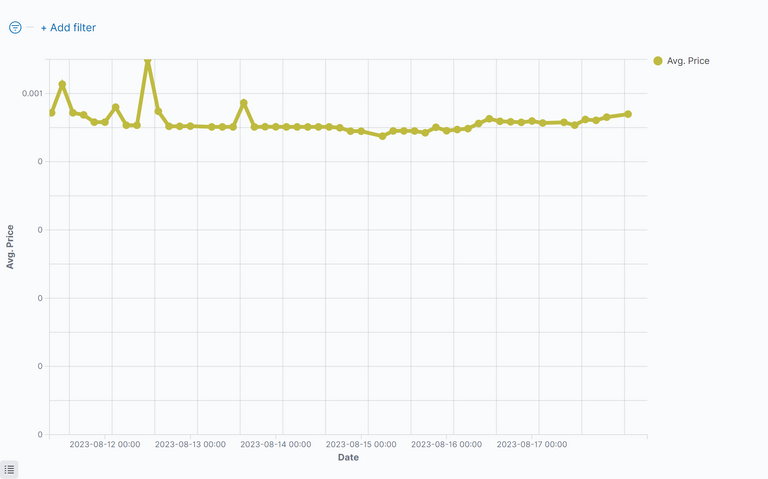
Price Of The $SPT
This figure shows the price of $SPT for the last period:
$SPT Summarize Metrics
This table shows how much $HIVE was given by buy-requests, that where equal or higher than the sell order vs. sell-requests, that were equal or lower than the buy order.
If the buy-requests where higher than the sell-requests, then money comes into the system and the value of the token increases.
Under the total line one can see the sum of $HIVE and sum of $SPT that changed the ownership and the average price of $SPT for the last period.
| Request | Received Hive | Received HIVE % | Sold $SPT | Avg. Price |
|---|---|---|---|---|
| sell | 185.53079 | 78.03% | 403607.08162 | 0.00046 |
| buy | 52.23336 | 21.97% | 109690.73069 | 0.00050 |
| sum: | 237.76415 | 100% | 513297.81231 | 0.00048 |
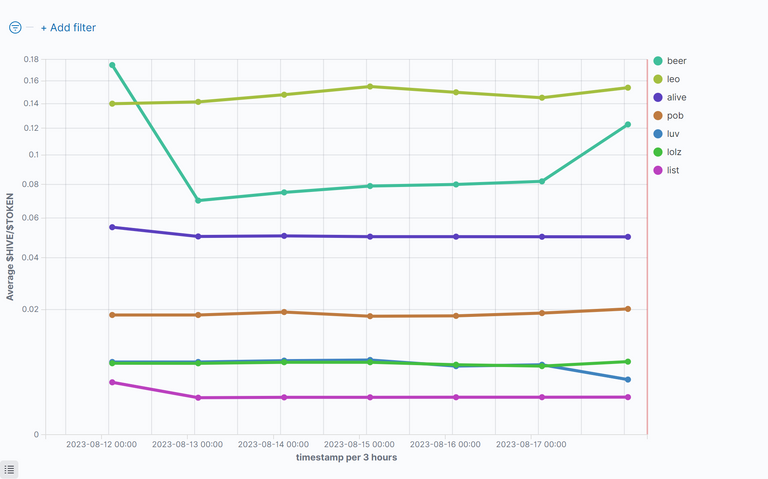
Comparison With Other Tokens
$HIVE/Token
This figure shows the value of $HIVE compared to some token for the last period. Be aware of the nonlinear (root square) y-axes.
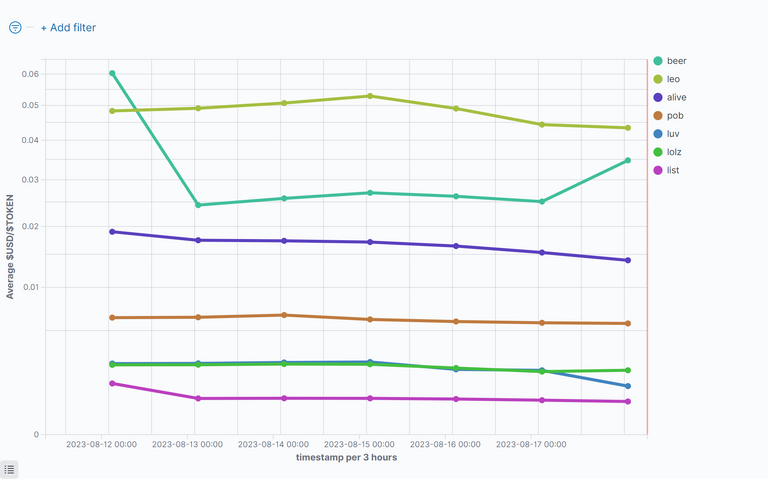
US-Dollar/Token
This figure shows the value of $USD compared to some token for the last period. Be aware of the nonlinear (root square) y-axes.
The HIVE rank in Coinmarktecap is: 158
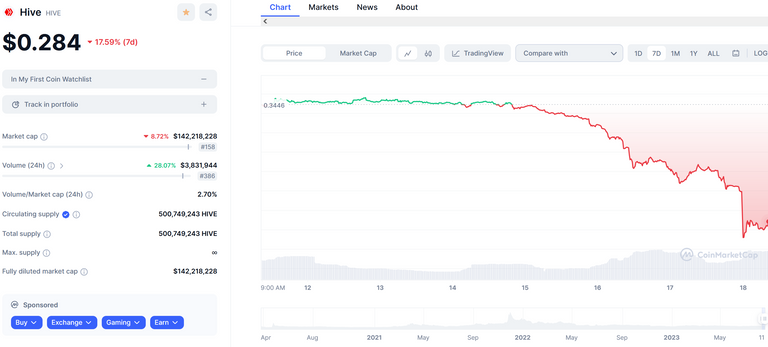
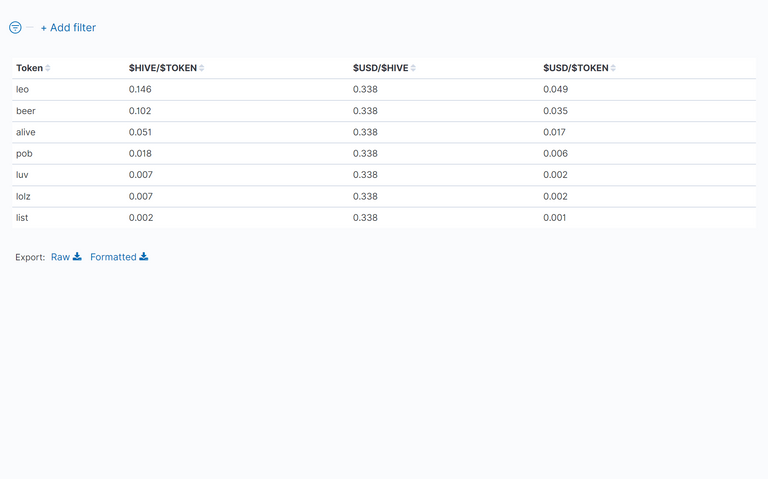
Table Of Token Prices in $HIVE and $USD
This table shows the average value of the prices of the token for the last period. One can see Hive and the US-Dollar compared to the token.
Disclaimer
All stats are without warranty.
They are taken from:
curl -XPOST -H "Content-type: application/json" -d '{ "jsonrpc": "2.0", "method": "find", "params": { "contract": "market", "table": "tradesHistory", "query": { "symbol": "TOKEN"}, "limit":1000, "offset": 0 }, "id": 1 }' 'https://api.hive-engine.com/rpc/contracts'
I have put them into logfiles and uploaded them to Kibana, from which I took the screenshots.
If you find errors, please tell me!
If you want me to continue the stats, give me some good upvotes ;-)
If you want to see other statistics (even from totaly other data), please contact me. I can create them weekly or monthly if I get some rewards for it.
For more details see here: How I Have Set Up Elasticsearch And Kibana On My Raspberry Pi To Monitor Token Activities and here: Do You Want To See Statistics Of Your Favorite HIVE Token? or on github.
Here are the stats from the other tokens I observe: https://peakd.com/@achimmertens/posts?filter=stats
Remark
All the Hive and HivePower, which is generated with this post, goes to my other account @anobel. I donate there the Hive to people that do good things and post about it.
You may follow @anobel and support my work there. See the latest post:

Regards, Achim Mertens