Chart visualization of Splinterlands Team performance
Splinterlands Team performance - Chart visualization
In my previous posts, I've discussed how to gather your Splinterlands battle data and analyze it to score teams and cards based on the performance with others.
I always thought it would be cool to visualize the data. Also, it will be easy to look up any team and scores. Thus began the search for one, and found this cool example code introducing Chart.js.
you can find the below code here
Creating HTML to view Charts
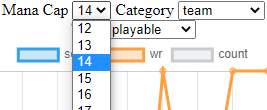
Using HTML select lable to select mana-cap, category (team|summoner|monster) and the availablity.
//scores.html

    <label for="mana-cap">Mana Cap</label>
    <select id="mana-cap"></select>
    <label for="category">Category</label>
    <select id="category" type="text">Category</select>
    <label for="type">Type</label>
    <select id="type" type="text">Type</select>
These can be populated later with options in script with jQuery. We supply an array of options and then create them for their respective selections.
|  |
|---|
| This is where the chart goes to. |
|---|
The remaining magic goes in JavaScript.
Chart.js -> Splinterlands Team Scores
Get Scores with ajax
var scores = $.ajax({ url: "http://localhost:3000/Standard", async: false, dataType: 'json' }).responseJSON;
Got the scores data from a JSON-server which hosts the data like an API. responseJSON will allow us to store the data in a variable that will be available throughout the script.
the Initial Chart
A Skeleton chart without any data can be later updated based on mana-cap or other dataSets. the chart will be of type line with no initial data. But the options sections are predefined since they won't vary when we change the dataSets.
| Create a new line chart, with empty dataSets and populate it in Canvas elementById 'myChart' |
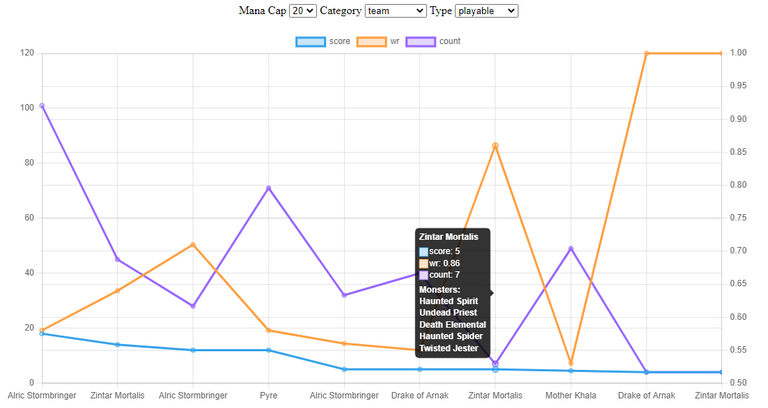
| This option will set the interaction type to index, which means whenever my mouse pointer is on the chart, a toolTip will appear giving me additional info |
| scales will set the axes we use.x being the horizontal one.default one for the vertical leftwr for the vertical right |
| footer is a callback functionfor footer of the tooltip, where i can displaythe monsters of the team by searching the score dataset |
The final chart is a result of the above options.
Getting the Score DataSets
Whenever the select options change, we call the function getBattleData().
    $("select").on('change', function(){
      getBattleData();
    });
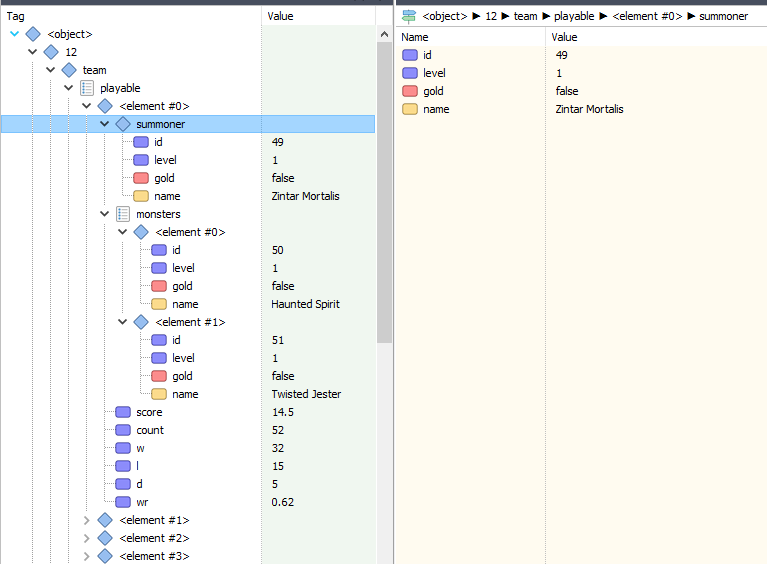
Based on the above score for a team, I create a dataset to be pushed for the chart as follows.
function getBattleData() {
  scoreData = scores[$("#mana-cap").val()][$("#category").val()][$("#type").val()];
  scoresChart.data.datasets = [];
  ['score', 'wr', 'count'/*, 'w', 'l', 'd',*/].forEach(el=>
    scoresChart.data.datasets.push(dataSet(el)));
  scoresChart.data.labels = scoreData.map(x=>x.summoner?x.summoner.name:x.name);
  scoresChart.update();
}
And then update the chart.
I am new to javascript and HTML. If any suggestions, then please comment.
Yay! 🤗
Your content has been boosted with Ecency Points, by @azarmadr3.
Use Ecency daily to boost your growth on platform!
Support Ecency
Vote for Proposal
Delegate HP and earn more
I hope you can add force use of summoner and team so we can add silver league data manually