Bitcoin Dominance Rate (BTCD) Bounces at Long-Term Support

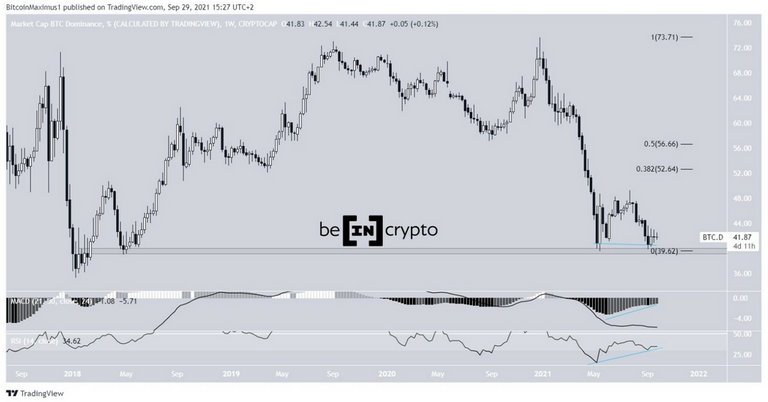
The Bitcoin dominance rate (BTCD) has created a double bottom at the long-term support area of 39.50%.
While it has broken out from a descending resistance line, it has yet to clear a crucial resistance area, which would confirm that the trend is bullish.
Long-term double bottom
BTCD has been decreasing since the beginning of the year. This led to a low of 39.66% on May 19.
After a slight bounce, the rate dropped to the 39.50% support area once more in the beginning of September. This created a double bottom pattern, which was combined with bullish divergence in both the RSI and MACD.
In addition to this, the double bottom is considered a bullish pattern. Therefore, an upward movement could follow.
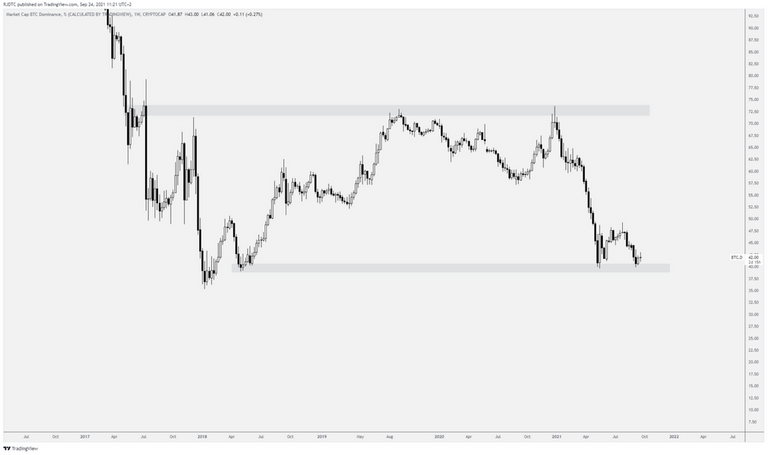
Cryptocurrency trader @DTCcryptotrades outlined a BTCD chart, stating that the current level does not support high altcoin exposure. This fits with the image outlined above, because of the long-term support area, and the presence of both a bullish pattern and bullish divergence.
Ongoing BTCD breakout
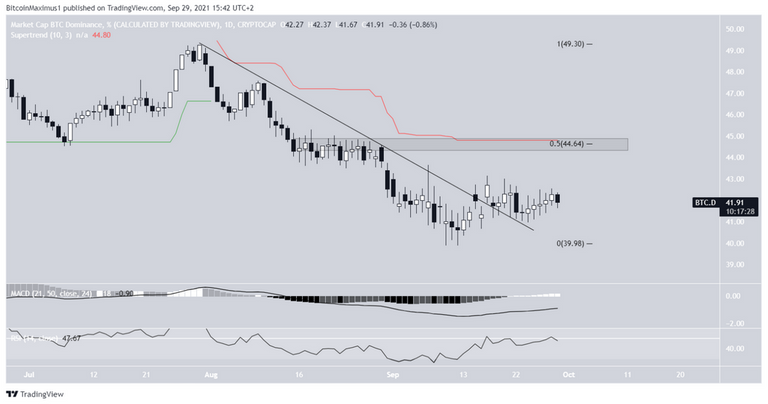
The daily chart shows that BTCD has already broken out from a descending resistance line that had been in place since July 30.
The breakout is somewhat supported by the RSI and MACD. While both are increasing, the former is still below 50 and the latter is negative.
There is very strong resistance at 44.5%. The resistance is created by the 0.5 Fib retracement resistance level, the Supertrend line (which is bearish) and a horizontal resistance area.
Therefore, until it breaks out from this area, the trend cannot be considered bullish.
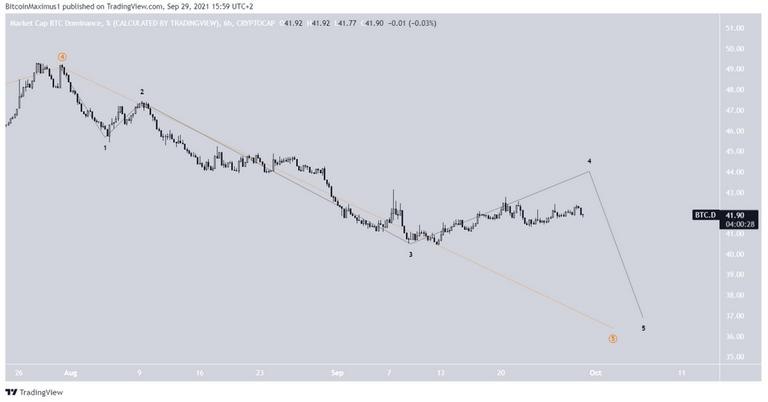
Wave count
The most likely wave count suggests that BTCD is in the fifth and final wave of a bearish impulse (orange).
The most likely target for the downward movement is between 33.89-35.85%. It is found using the length of wave one (orange) and an external retracement on wave four (black). This would lead to a new all-time low.
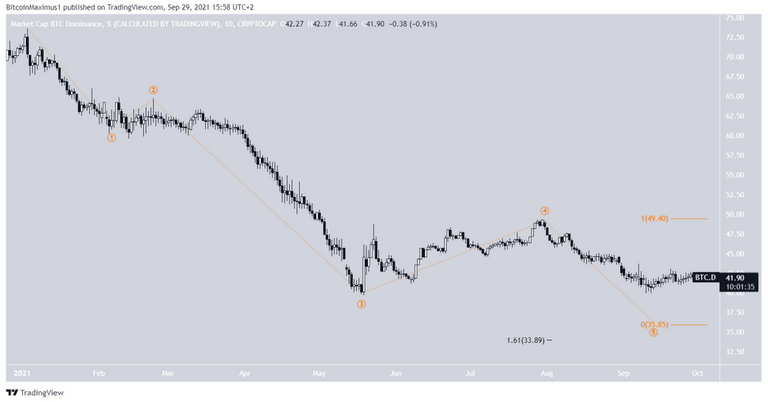
An even shorter-term outlook shows that BTCD is likely in the final sub-wave of the final wave. Therefore, it is expected to reach a bottom soon and initiate a significant upward movement afterwards.
For BeInCrypto’s latest Bitcoin (BTC) analysis, click here.
Posted Using LeoFinance Beta
Electronic-terrorism, voice to skull and neuro monitoring on Hive and Steem. You can ignore this, but your going to wish you didnt soon. This is happening whether you believe it or not. https://ecency.com/fyrstikken/@fairandbalanced/i-am-the-only-motherfucker-on-the-internet-pointing-to-a-direct-source-for-voice-to-skull-electronic-terrorism