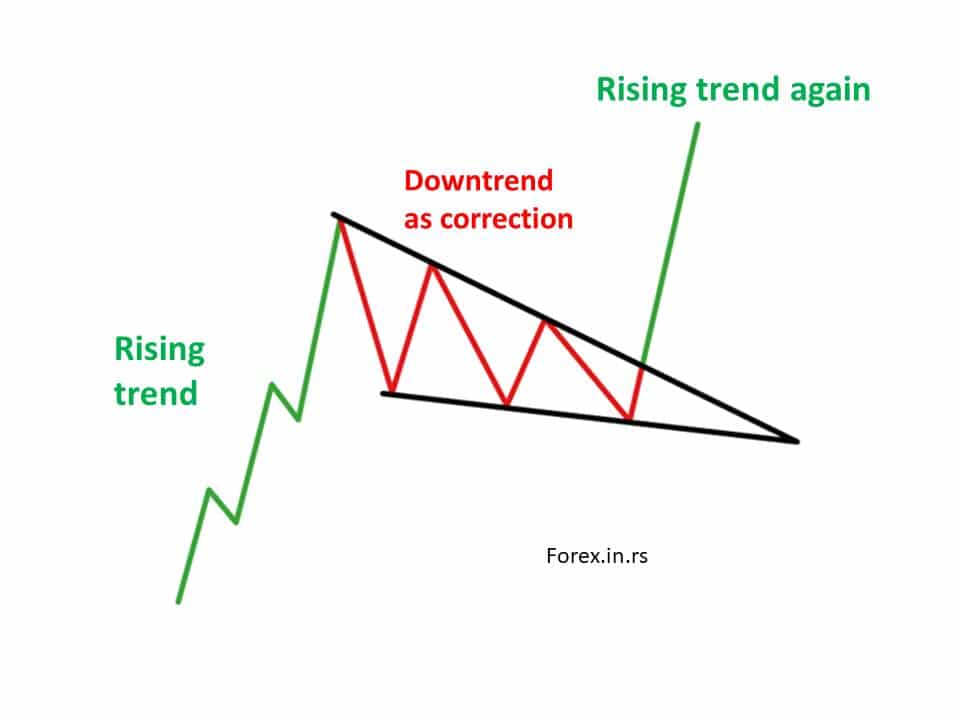
Falling Wedge Pattern is on SPS Price Chart
SPS price is going down as BTC price after seeing ATH 69K. SPS price draw falling wedge pattern and It is on edge now. It may break up in a few days...
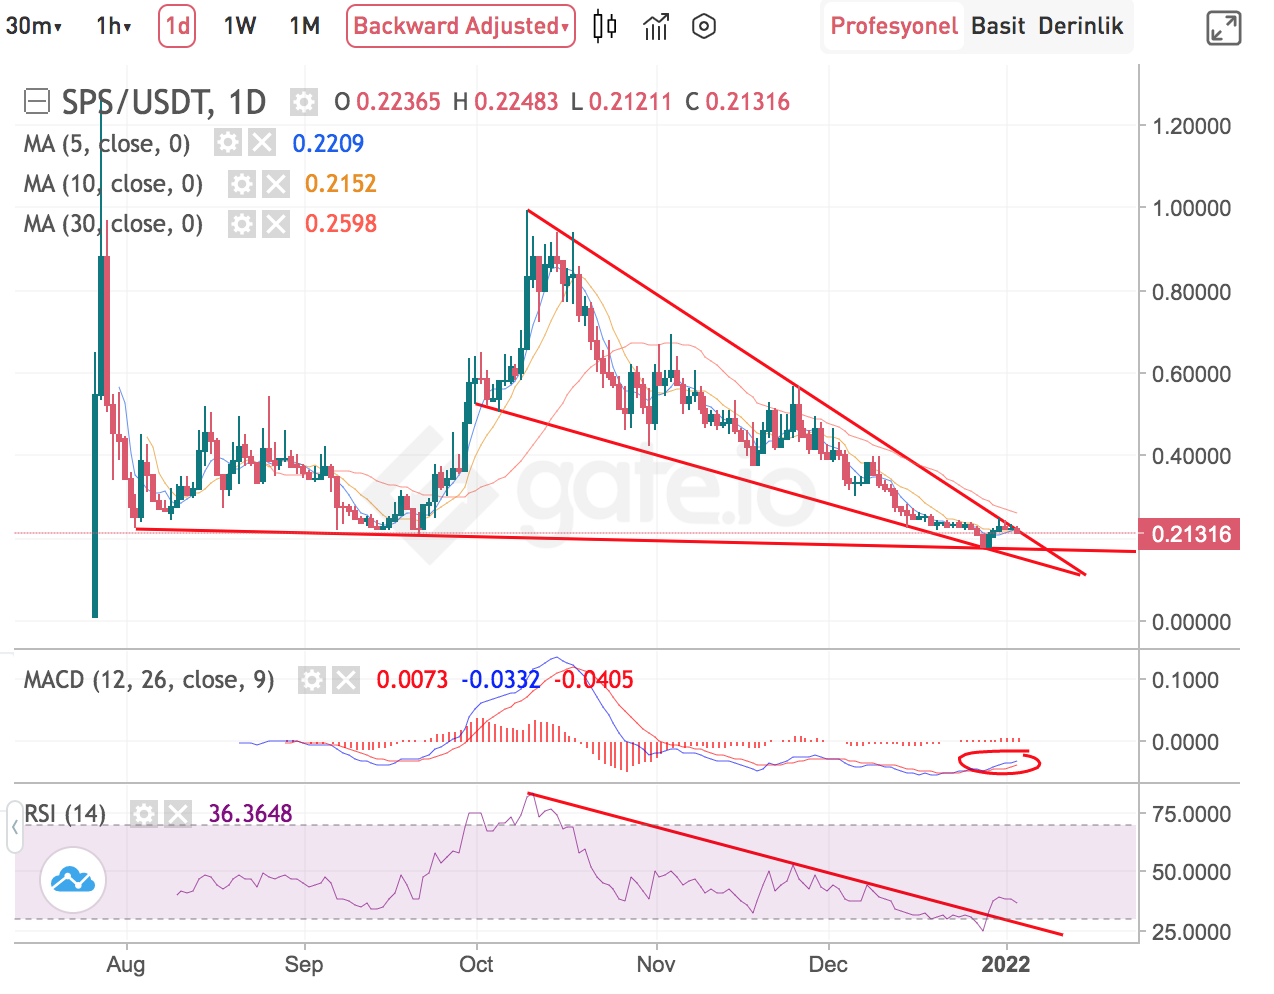
If price breaks the wedge up, bullish trend will begin...
There are lots of bullish signals on SPS price chart and lots of fundamentals...
- RSI Indicator broke up great resistance,
- MACD Indicator has signal of turning the trend,
- SPS utilies will begin on Splinterlands,
- 2022 will be the year of NFTs.
After ending Airdrop and get utilities, SPS will have chance to be listed on big exchanges...
Time to pick up...
Posted Using LeoFinance Beta
0
0
0.000
Hi @chorock
I wanted to ask you for your support and vote on the @pizza.witness Witness run by @hivetrending and I. Our team (and our community) are working tremendously hard to create more awareness for the HIVE blockchain through various things such as but not limited to:
Please let me know if you have any questions and thank you for reading and for the consideration!