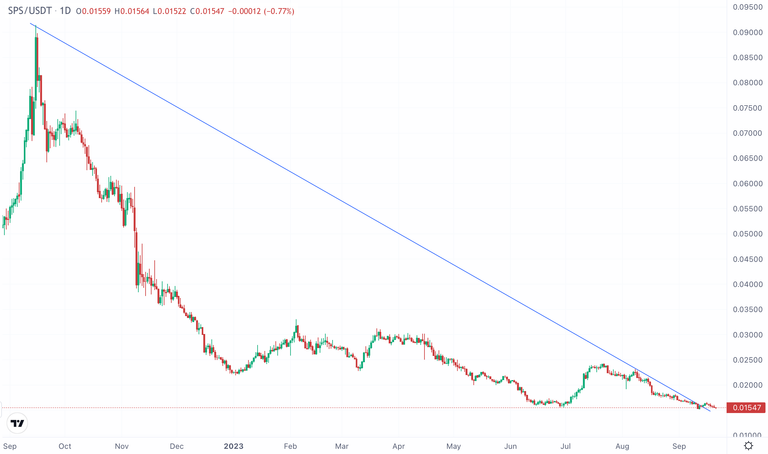
SPS Price Broke Up 1-Year Downtrend Line
SPS Price broke up 1-year downtrend line coming from September 2022. Even SPS price is going down from 0.025 USD to 0.016, It broke up the resistance a few days ago..
Here you can see daily chart of SPS. It is going down since Sepmber 2022. SPS price went down for a year.
SPS price went up 70% in this Summer from 0.016 to 0.024 USD but it is going down since August...
Here you can see weekly chart of SPS. There are lots of red candles in weekly chart of SPS. Even there are lots of weekly red candle, the length of red candles are getting smaller.. So we are going the bottom of SPS price. It may be close to reverse?
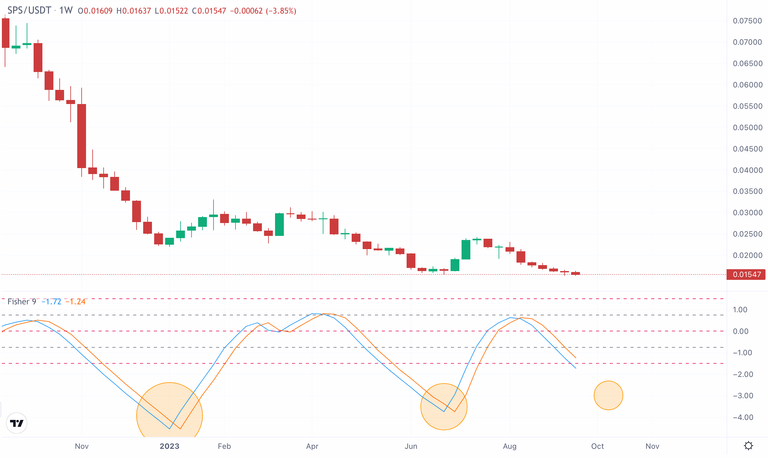
When we look at Fisher Indicator, SPS price is close to the bottom. It will reverse in a few weeks.
So, It may be time to pick up discounted SPS.
We will see..
Posted Using LeoFinance Alpha
https://leofinance.io/threads/chorock/re-chorock-fascnc1h
The rewards earned on this comment will go directly to the people ( chorock ) sharing the post on LeoThreads,LikeTu,dBuzz.