SPS Chart Watchers (Oct 29, 2021): BREAKOUT!

Hello Chart Watchers!
Soo... remember I said a couple of days ago, that to snap out of the downward funk we've been having...
_"Is there a way out? Yes. Remember, break the trend, make a new friend. That means, to invalidate the bearish pattern we'll have to rally and break the now resistance line of 56 cents. We also need to break the upper trendline of the broadening channel to get out of here. Until these two happen, I'm afraid to say: The pattern that's in play is valid until invalidated away." _
WE'VE DONE IT! WOOO! Now, before we get ahead of ourselves, let's first keep stock of where we are.
Break the trend, make a new friend

The best thing about that rally is it broke two trends at the same time. First, the price movement today has officially INVALIDATED (woot!) our descending triangle and the corresponding technical target of 40 cents. Second and more importantly, it broke the broadening descending channel upper trend line.
What if we go down from here? Now that we have blasted out of the trendline, we can afford to go back down and test it support if we wanted to. The key thing to note here is we cannot afford to go back in the channel. Any price action outside, we're good and can focus on new price patterns emerging.
Now that we've come out of the other side of this bearish fall, you may be wondering, where do we go from here?
Lay down your fibs
The good thing about breaking out of the trend is we have establish two key elements to chart our way forward: a local top, and a local bottom. Whenever this situation appears, it's time to lay down our fibs.
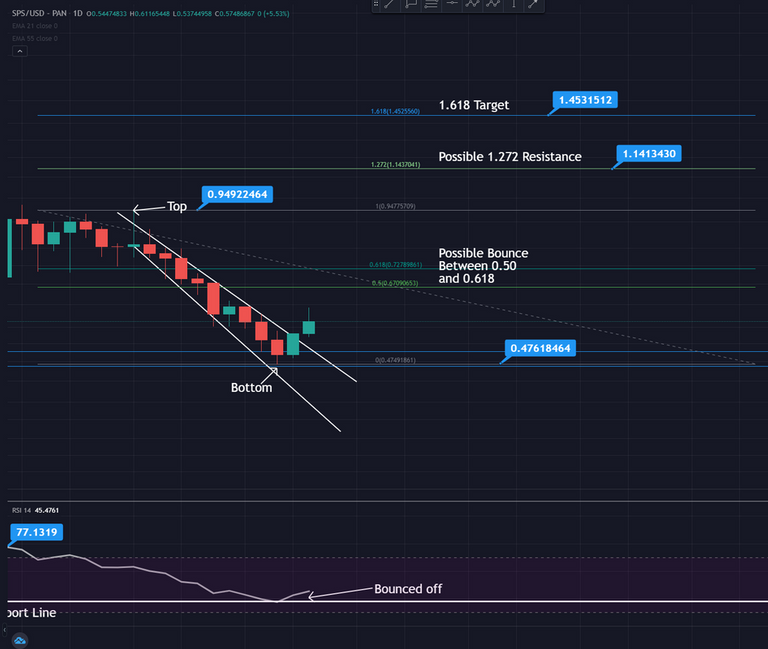
For those unaware, this indicator is called the Fibonacci Retracement tool. Quick history, a mathematician named Fibonacci found that nature consistently adhered to a particular sequence of numbers, and it was everywhere: from growth cycles, seashell growth, etc. In the early days of trading, some blokes found that price action also tended to mimic this sequence. The funny part about that observation though, was it eventually became a self fulfilling prophecy. Because a lot of people use it, a lot of people adhere to its principles so their trading / investing strategies now mostly adhere to the sequence.
So, the impulsive wave for SPS takes us to a journey to the 1.618, which is around 1.45 dollars. The short term destination is a rocky up and down between the 0.50-0.618 region. The 1.272 area also would serve as resistance, and from there, we reach our eventual target. I don't know when exactly this would happen, it also won't be smooth sailing along the way, but we'll eventually get there.
How do I know all of this though?
Look to the left

All it takes is to look at SPS' price action when it fell from 50 cents to 20, then rallied all the way to 1 dollar. If we lay down our fibs, look at how the price action played out: a run up to 0.50 (got rejected), then got in between 0.50-0.618 and rocked up and down for a while, shot past the 1 area and met 1.272 as resistance, and eventually reached our target of 1.618.
Let's see if the same patterns play out. In the meantime, stay safe, have a good weekend and HODL strong everyone!
_________________________________
Like what you see? Upvote and follow me for constant updates on SPS! Thank you all!