SPS Technical Analysis (Oct 25, '21): Battle At The Trenches
Hi everyone!
Soo... remember in our discussion yesterday (click here), we talked about this particular scenario hopefully playing out?
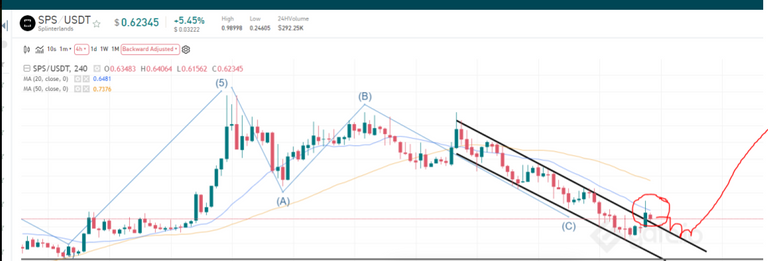
"... What we need to see is similar to the attempted trend break above. There's a clear trend break, and even if the price goes lower, it uses the upper black trendline as support and holds it. "
Well...
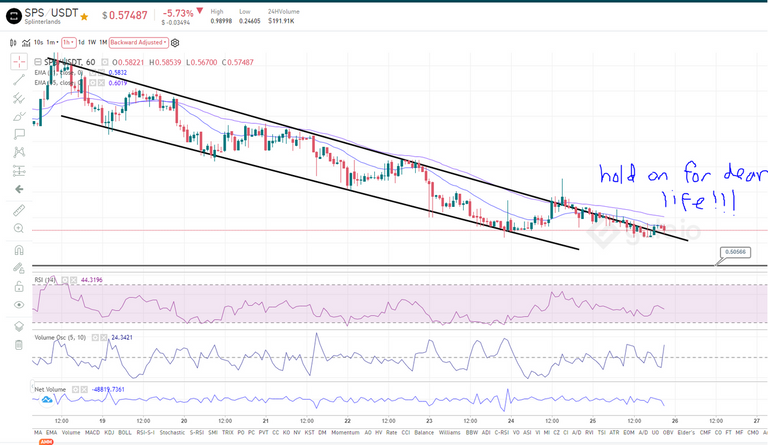
The good news was the bulls did show a good fight, battling at the trenches of the upper trendline of the descending channel instead of just free falling to the bears. The bad news is we're unfortunately still falling down the channel, with the technical target of 0.50 cents still at play.
However, I don't want to end this update with a sad note, so here are a few things to watch out for that'll signify a higher probability that we are back in an uptrend.
Scenario 1: W Double Bottom
A W double bottom would look something like this.
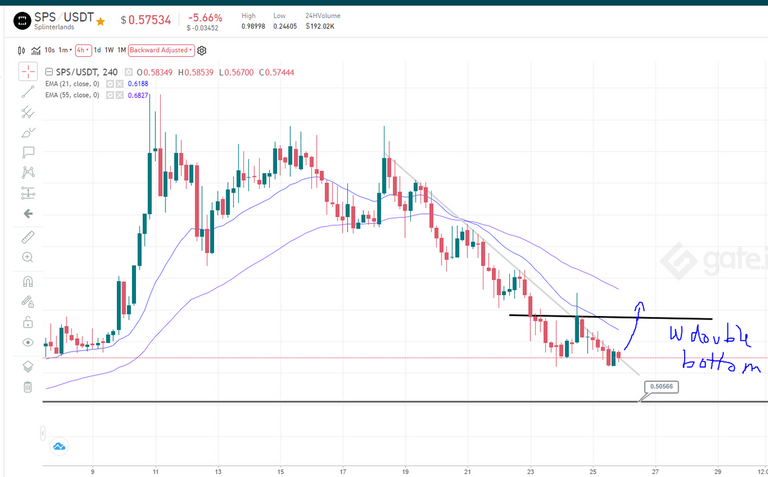
This is the most bullish scenario, and probably less likely unless a significant event happens that spurs a lot of buying pressure over the next couple of days. It isn't also an ideal W bottom because in a bullish version, the second buttocks (:D) should be higher than the first to signify a higher low. In any event, the thing to note about a W bottom structure is price has to shoot past the trendline where the W forms to validate it. Once that trend breaks, ideally, the price should test that same black trendline as support to give confidence that we're good for continuation.
Scenario 2: Head & Shoulders (Not the Shampoo)
The second and more realistic short term bullish scenario would be the formation of an inverse head and shoulders pattern that'll look like this.

For those unaware, a head and shoulders pattern consists of... well, a left shoulder, a head and a right shoulder. The inverse of that would pretty much be Spiderman appearing in front of you from the roof.
Dad jokes aside, what you need to look out for is what the price does at the black trendline. When a relief rally comes, but gets rejected, but then rallies back and breaks the trendline, that is a very strong signal that we're back for bullish continuation. It'll even be better if after the trendline break, it comes back and tests it as support, giving confidence to the market that we can continue.
Well that's it for today. :) If we don't rally anytime soon, then we continue our march to 0.50 cents. Otherwise, keep calm and HODL on.
Take care everyone. Stay safe!
Congratulations @drini! You have completed the following achievement on the Hive blockchain and have been rewarded with new badge(s) :
Your next target is to reach 200 upvotes.
You can view your badges on your board and compare yourself to others in the Ranking
If you no longer want to receive notifications, reply to this comment with the word
STOPCheck out the last post from @hivebuzz:
Support the HiveBuzz project. Vote for our proposal!