What cards you MUST choose to WIN: A Data Analysis

*You will understanding why Furious Chicken is here at the end.
Today we are going to analyze 25,000 matches from the bronze, silver and gold links.
I have an important caveat to be made first of all, it has not (yet) taken into account the level of the cards (and this could be influencing a lot).
To improve the analysis, at some points I will delimit the analysis by mana range into 3 types: low mana games (<=15), medium mana games (16 < x <= 27) and high mana games (27>).
In this post, we will have two topics:
- Analysis of teams with higher win rate (for your information: position is a determining factor in my analysis, so a team with A and B is not the same team with B and A).#### Header 4
- Last but not least, the individual analysis of the best cards (win ratio normalized by the number of times chosen).
- After analyzing more than 25,000 games (25096), here's our mana pool distribution:

Header Let's first analyze the teams with the highest win rates using the low mana criterion <=15 (3736 games):
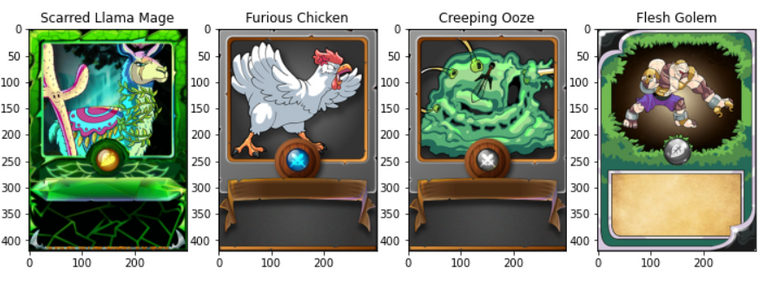
Right away we can see a team with 2 cards being used 125 times and getting a 67% win rate~:
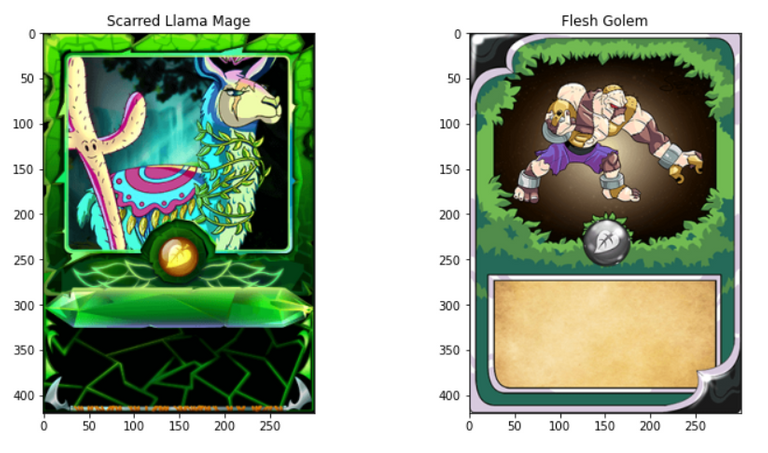
A Scarred Llama Mage as a champion and a Flesh Golem.
We had some points outside the curve, with 100% win ratio, however without statistical relevance as there are not many samples (only 4~5 games).
Are they:
*This chicken is op, right? haha.
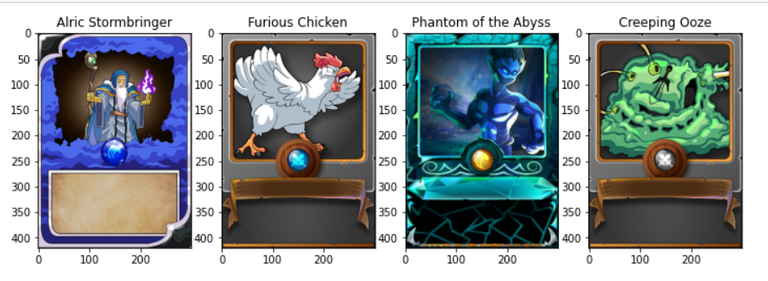
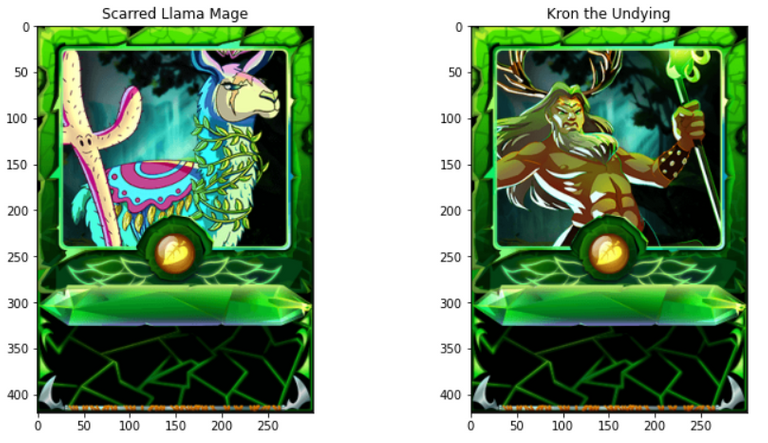
Theres a team that was played 12 times with a win ratio of 86%
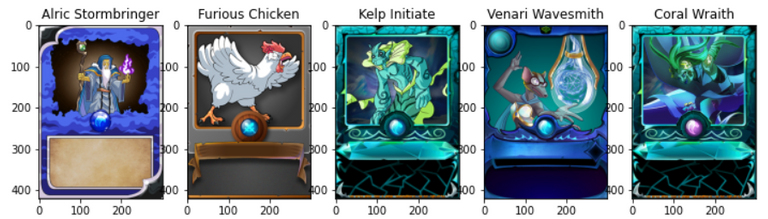
Leaving to the medium mana pool:
With 96 games and a 70.5% win ratio!
With the exception of this team, there were no other predominant teams.
Going to the maximum mana pool:
Here things seem to distribute better, although you can see that Llama appears constantly on many teams. I need to rethink my team modeling.
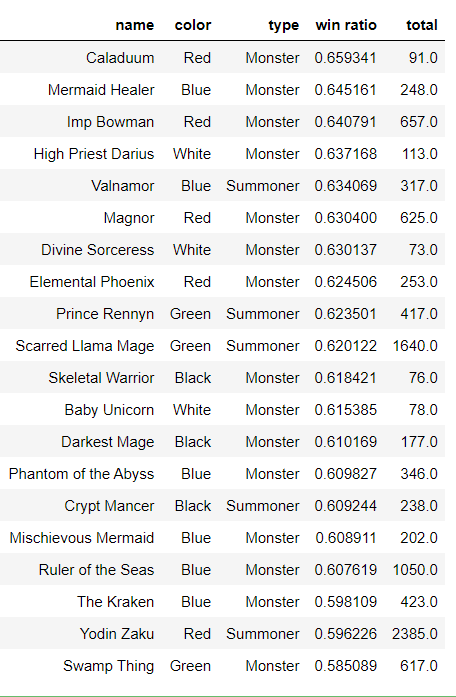
- And here we have our top 20!
Analyzing only by win rate, we have:
Analyzing by the number of times the card was chosen in the games, we have:
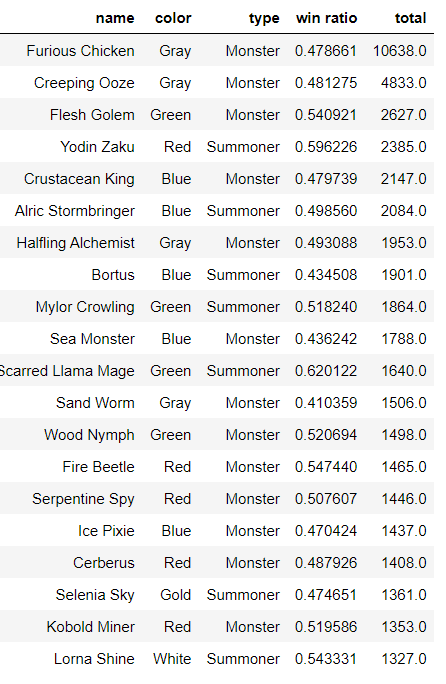
*Look the chicken again, it was choosen in 42.4%~ of the games (wow) and has a 47.8% of win rate! Maybe its better to invest in Llama (62%).
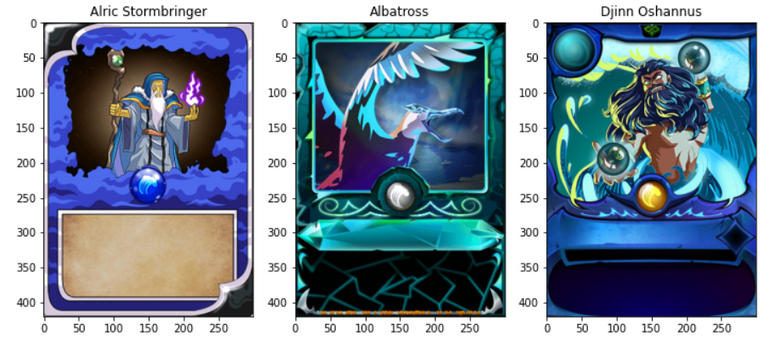
As Im still a beginner in the game, I ended up following some tips, like Djin + Venari, let's see if they appear applying only water cards:
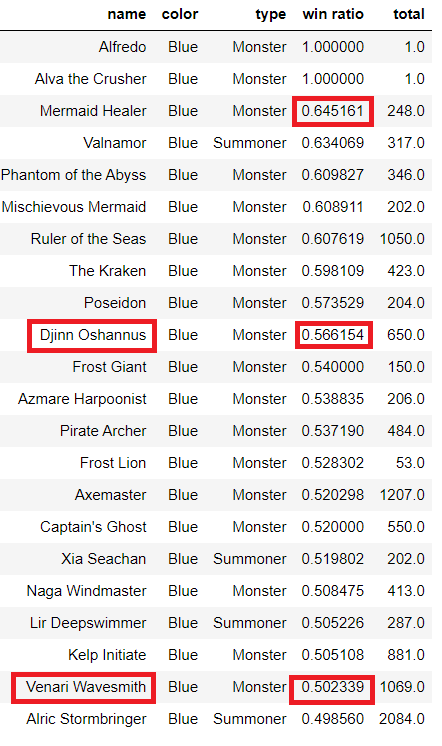
Well, thats pretty nice. I believe that because they are very widespread cards among beginners, there may be an anomaly due to the players' inexperience.
So, thats it!
My next analysis will target the top 100, seeking for anomalys.
Thanks for the reading!
Muito bom! Parabéns!
Valeu Mauricio!
Nice Analysis
Your post has been manually curated by @monster-curator Team!
Get instant cashback for every cards purchase on MonsterMarket.io. MonsterMarket shares 60% of the revenue generated, no minimum spending is required. Join MonsterMarket Discord.
Congratulations @lypisz! You have completed the following achievement on the Hive blockchain and have been rewarded with new badge(s) :
Your next target is to reach 200 upvotes.
You can view your badges on your board and compare yourself to others in the Ranking
If you no longer want to receive notifications, reply to this comment with the word
STOPGreat analysis. What models do you use to complete the calculations?
Hey holoz0r, no AI model was applied as there was no prediction (who knows in the future?). The entire analysis was purely statistical.
Thank you for your reply! I've been doing a bit of data processing for my own benefit using KNIME, I dabble in the lightest of data science and statistics, and your insights are far deeper!
Nice to hear! If you want to discuss some ideas or just ask something, you can call me on discord: Felype#6028.
Thank you for doing this. Hope to see a breakdown by league.
Hey gaming, thanks! Going to make a analysis by league.
Great post! Im following now. What are you using to pull in the data and organize it?
Nice and infomative post bro :D