Technical Analysis 101 - Patterns and Trends
Welcome to the 3rd issue of my technical analysis series so far we have covered the basics of exchanges like Coinbase Pro, as well as some simple charting tools and trading view. Now that we have covered the tools it is time to start into technical analysis and what it is. Technical analysis is looking market movements against historical data and known patterns and can be applied to pretty much any market without knowing much about the underlying asset. This can be seen largely as interpretive and not all people will agree on what metrics are the most useful. Fundamental analysis is the opposite of technical analysis, you are only looking at the underlying asset, what is who created it, who is involved, what does it offer, is there competition? Most traders will agree that both types of analysis are pretty important, in the absence of any news technical analysis will hold the most sway, but if a big story breaks the market could move in a way that technical analysis could never predict.
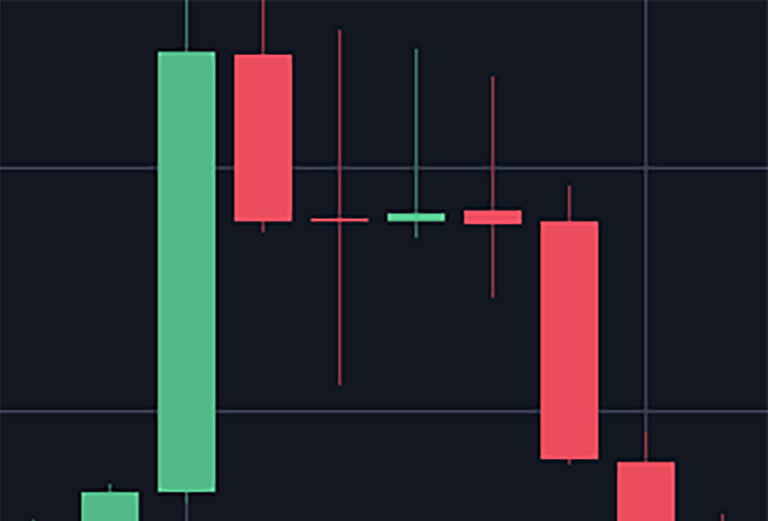
the body of the candle represents the open and close for that time period. If it is a green candle the open is at the bottom close at the top and a red candle is opposite open at the top close at the bottom. The little wicks coming off the top and the bottoms are the highs and the lows for that time period. In trading view this information is also in numerical form usually along the top, open, high, low, and close. What makes candles really powerful is when the form patterns or trends.
The three basic trends are down trends, side ways trend and uptrend. Within these trends there can be volatility and smaller trends but these are the three basic trends you are going to be looking for. being able to identify a trend that is on going is important but having insight into when a trend is about to shift is even better. lets look at some candles that can give as a hint when this shift is about to happen.
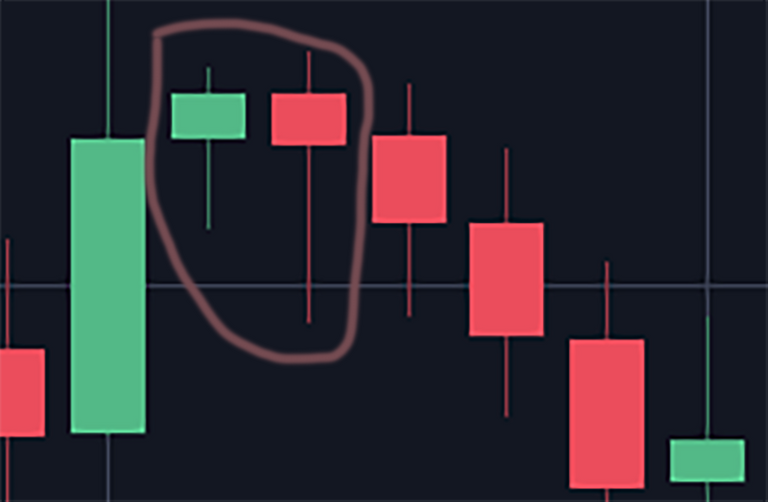
Marubozu candles are really long candles with short to no wick on either end. They can be green or red in our image we only have green ones. They indicate bulls if green or bears if red have taken complete control of the market they often occur at the beginning or during an on going trend, but if there has not been a lot of tall candles in either direction for a while and you see one there is a good chance it is about to start shifting in that direction. The other candle we are going to talk about is called a doji candle and is kind of like the opposite of a marubozu candle, they have very little body and mostly wick. They indicate there is no clear leader in the market and a lot of uncertainty this could be an idicator that the market is about to shift especially if it comes right after a marubozu candle however it could just be temporary uncertainty so you are going to want to watch candles that come after it.
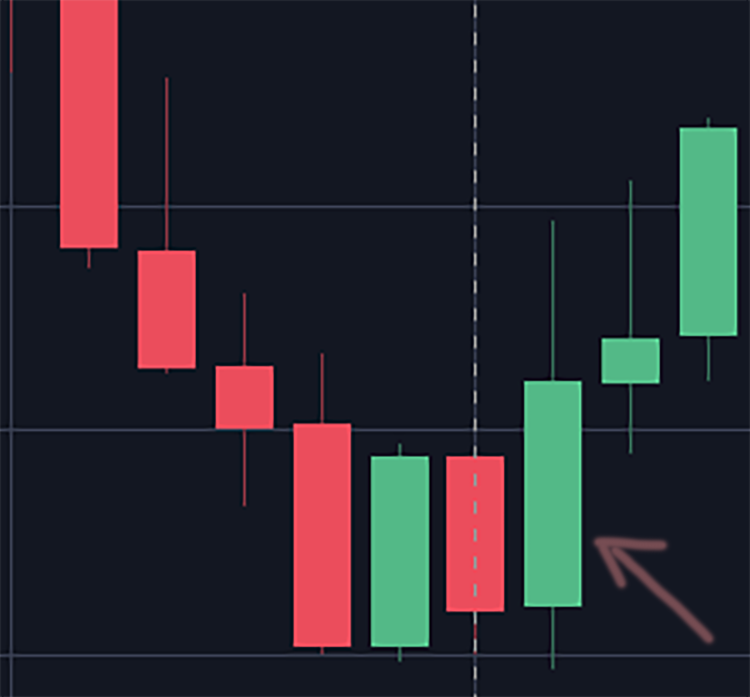
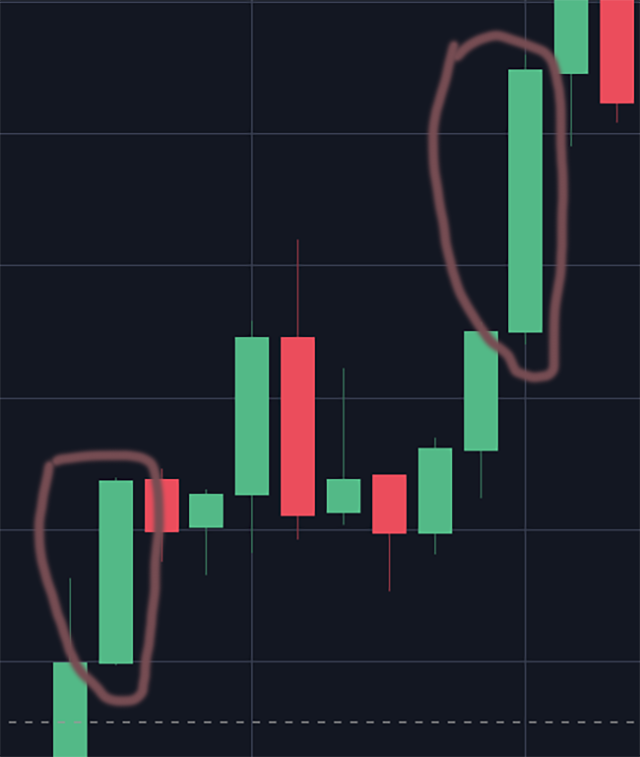
Engulfing candle pattern this is where the body of a candle in this case green, fully engulfs the body of the previous candle in this case red. What this means is the bears fully in control of the market but then the bulls came in even stronger dominating the market afterward and we are able to predict more of a movement in that direction.
another useful patter to look for is called the hanging man or Hammer. This is usually a small body with very little wick on top, but a long wick on the bottom. These can occur at the bottom or top of price movements but generally indicate a shift is about to happen or just happened.
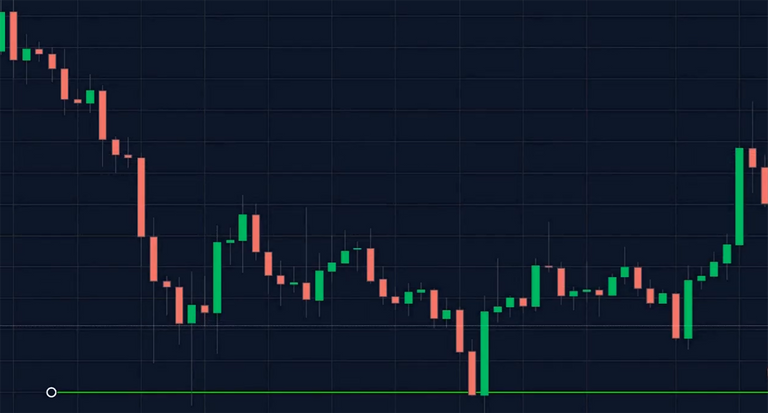
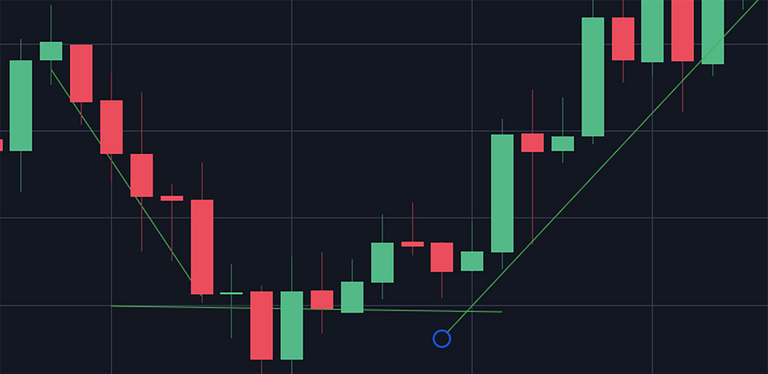
one last slightly more complex pattern is the head and shoulders pattern. This is when the price attempts to get past a certain level of support or resistance and is unable to. you can see in the image the price first attempted to break down past the level, tried a little harder and after the third attempt shifted direction. This can happen going up or down. Traders tend to watch for the first two attempt to form so they can pretty safely predict a third one will happen. It could of course cause a break out, if it gets rejected it cause a longer term movement away from the price point as we see in the image and traders can set their trade appropriately.
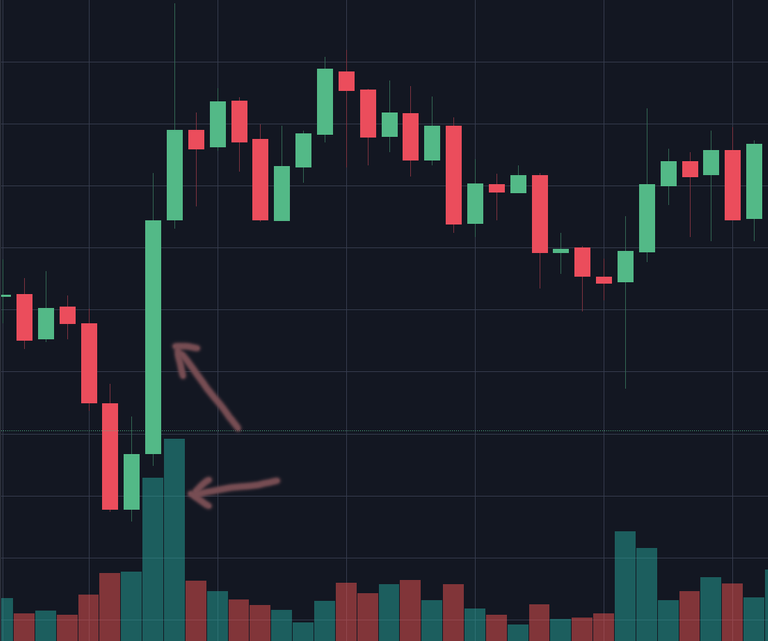
volume can be an indicator of confidence in a movement. High volume coinciding with sudden price movement can be an indicator a strong indicator. The idea is that the more people trading into a trend the more confidence you can have in it.
that is it for this issue, give me a follow so you don't miss future issues.
you can also follow me on twitter
Take a break and play2earn in Splinterlands with me.

Join the Cartel

0
0
0.000
Thanks for the breakdown on indicator candles! There were a couple I never knew the name of, like the Marubozu candle. Learn something new every day :)
!1UP
You have received a 1UP from @entrepidus!
@monster-curator, @oneup-curator, @leo-curator, @ctp-curator, @pal-curator, @pob-curator, @vyb-curator, @bee-curatorAnd look, they brought !PIZZA 🍕
Delegate your tribe tokens to our Cartel curation accounts and earn daily rewards. Join the family on Discord.
PIZZA Holders sent $PIZZA tips in this post's comments:
@curation-cartel(13/20) tipped @unlikelysurvivor (x1)
Learn more at https://hive.pizza.
Congratulations @unlikelysurvivor! You have completed the following achievement on the Hive blockchain and have been rewarded with new badge(s):
Your next target is to reach 700 upvotes.
Your next target is to reach 100 replies.
You can view your badges on your board and compare yourself to others in the Ranking
If you no longer want to receive notifications, reply to this comment with the word
STOPCheck out the last post from @hivebuzz:
https://twitter.com/UnlikelySurviv1/status/1484571853767143424
The rewards earned on this comment will go directly to the person sharing the post on Twitter as long as they are registered with @poshtoken. Sign up at https://hiveposh.com.