Trap or Deal : Using Peakmonsters and Splintercards to Analyze Cards on Sale
Everyone likes cheap cards, but is it really a discount? Let's find out!
Some card I picked at random: Spineback Turtle. As you can see it features a sharp discount on the per bcx side vs bcx 1. But is it really a deal? It's find out.
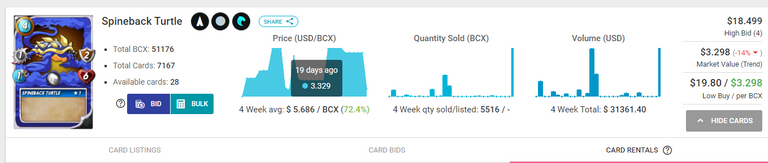
The price pattern is choppy over a month, and it appears barely active. By mousing over the three graphs, you can get an approximation as to what sold, at what BCX. The first image shows my cursor over the price graph. 19 days ago at 3.329.
Now, to match that up with quantity sold:
Also 19 days ago, 392. Which tells you that a card of 392 or less BCX was sold because all sales are aggregated on to one day. There's a drastic disparity in price between one bcx and multiple bcx.
Since the quantity sold graph doesn't often go above both 392 and the price above the original 3.329 We can assume that the card is highly illiquid.
To further analyze if the card is a deal or not, we can use Splintercards. https://splintercards.com/alpha-spineback-turtle
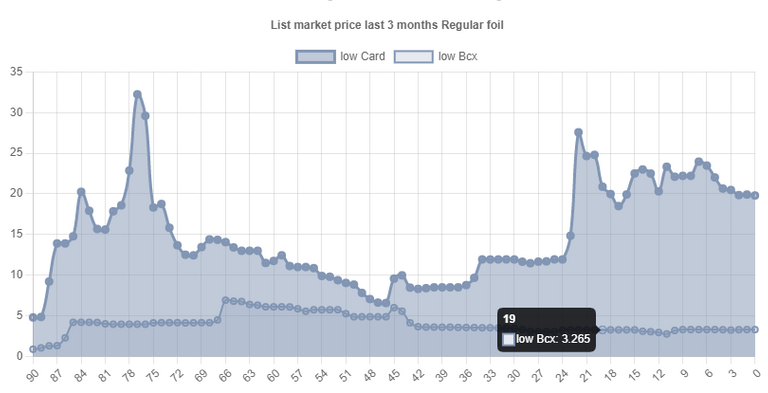
The low BCX line in the graph is mostly flat. This tells us there are hardly any eager buyers for the card. Splintercards also gives us a far longer timeframe to look over.
90 days compared to a month.
Congratulations @wildebunny! You have completed the following achievement on the Hive blockchain and have been rewarded with new badge(s):
Your next payout target is 50 HP.
The unit is Hive Power equivalent because your rewards can be split into HP and HBD
You can view your badges on your board and compare yourself to others in the Ranking
If you no longer want to receive notifications, reply to this comment with the word
STOPTo support your work, I also upvoted your post!
Support the HiveBuzz project. Vote for our proposal!