A new? Metric for the card market
As many of you, when i started this jurney in early october last year i was wondering if it was worth to buy some cards or just rent them all.
I got over it by posing few more questions, such as:
what is the opportunity cost? Or, is this card going to be more or less usefull in the long run? Is it going to appreciate? And if it will, is it going to appreciate more or less than this other asset? And eventually, assuming the prices are not changing, for how long can i rent this card with the money that i would spend to buy it?
Those are very tough question to answer, and ofc i got them wrong. I bought some cards that would have been much better if i’d only rented.
But, this is not the point, the story is just to introduce how i started to look at the buy price/rent price ratio. And now i’m about to show you what i found in the cave, but before, few disclamers:
DISCLAMER
I’m very new here, in the finance and in the crypto space, i believe this is original and useful work, i checked out in the splinterlands blog and i didn’t found anything like that. But still, i may miss something, or all of it may be much less useful than i think.
The Buy Price/Rent ratio (PR) that i’m presenting has many nice use cases, but it should never be used alone to justify a purchase decision. It is just one of many tools that one can use to discriminate among bargains and to understand the market cycles.
The work i’m presenting is at its start, and relies on very few data points, it is mostly just a proof of concept and its purposes are to check if that is actually original and useful and to start a discussion among the topic with veterans to provide better interpretation of the results.
I know that a card is not the same of other asset classes: it is deflactionary, it has utility and use cases, it can be rented out. But, for many asset classes we have a lot of metrics that can help us on the valuation of the single one and of the overall market of them.
In the stock market we are plenty of metrics, even too many, take the PE ratio, we can use it to identify the category of a stock, we can use it to evaluate if the stock is under or overpriced, we can use it to identify overall trends in the entire stock categories (e.g. low cap, growth stock etc) and even in the entire stock market.
The closest thing i see in the splinterlands card market is the card buy price vs its rent price, we are not taking in consideration the deflationary force nor the utility of the card, but for the purpose of imitating the PE functions it wont be a problem, moreover, those properties are strictly bounded to the PR and its interpretation can lead to theyr estimation, at least an estimation of the percieved value of utility and deflationary potential.
How exactly i calculate the PR?
It’s simple, i take the lowest price for a single bcx card (not the lowest price per bcx) and divide it by the lowest price for its renting. That will represent how many days one can rent a card with the money he need to buy a single copy of it, if the prices don’t change.How i took the data points that i’m going to show?
Well, that is sad, but i’m not the smartest guy when we talk about programming, i barely know what api means. Thus, i just went to peakmonsters.com, copied the tables and pasted them into a precompiled xl sheet to extract the data i needed. I repeated the operation for every single class i decided to investigate once a day for, at the moment, 3 days. Which means that there will be some outlier, and it would be much better to work with averages, but in the long run it wont be an issue.Which data am i going to show?
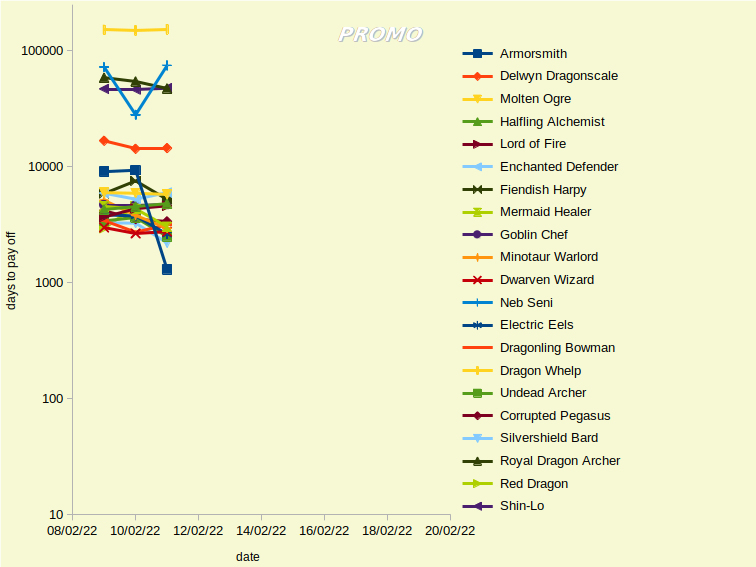
The purpose is mostly to see how an asset class has its own PR range, so i took all regular foils divided by edition, in order to show how the PR increase with the age of the card. And i took all the summoners of the beta edition and all the monsters of the same edition but divided by rarity (also only regular foils), in order to show how we can extract percieved utility and valuation from it.Am i going to show those damn chart eventually?
Yes
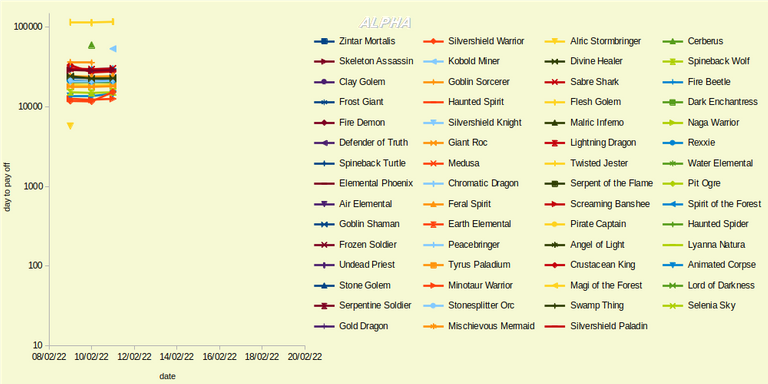
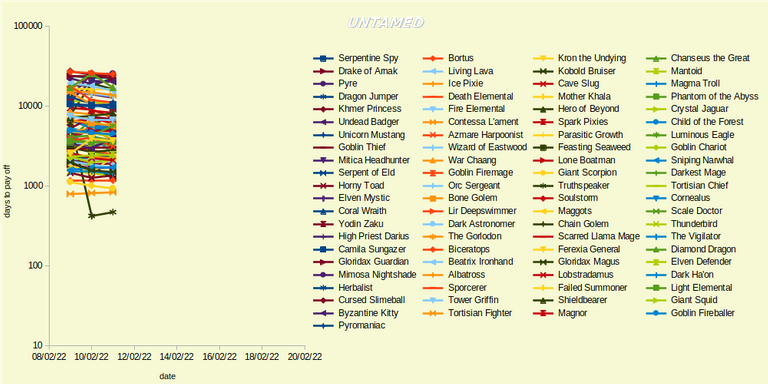
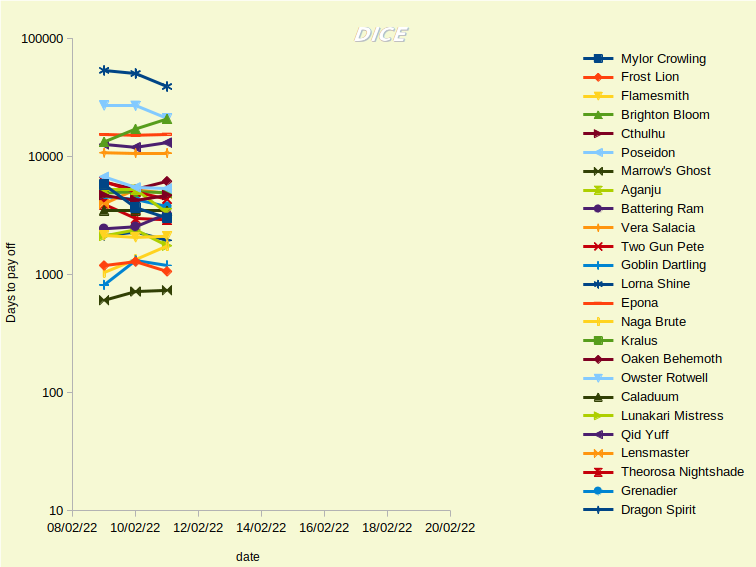
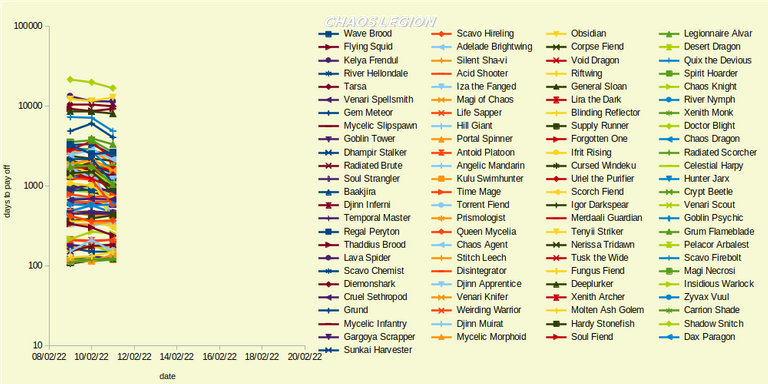
As you can see theese charts are huge, i apologize for it, it’s the best i could have done. Anyway on the Y axis we have the PR ratio in a log scale, all the charts have more or less the same scales and the same dimensions, thus we can compare them easily.
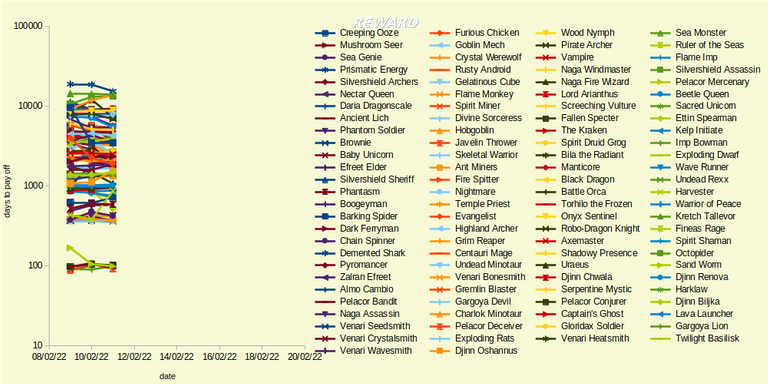
We can see that the PR spreads among 4 orders of magnitude, from 100 to 100,000 days for the amortization of the card cost, and we can also observe that Alpha and Promo edition concentrate themselves in the upper side of the chart, followed by the Beta edition slightly lower, while Untamed, Dice, and Chaos Legion are more disperse. Reward edition is a peculiar case and we will discuss it later on.
I’d like to highlight that some of the PR values are extremely high, while others are extrimely low: a PR of 100 means an ROI (from the renting alone) of 100% in 3 months, while 100,000 means the same 100% in more than 250 years.
Among the feasable considerations there are few quite obvious, some of the cards have a very low buy cost, while the rent price hitted the bottom of 0.1 DEC/day, without this treshold the rent price would probably reach a much lower equilibrium, and the resulting PR would be higher (a proof of that is the near zero liquidity in the rental market for those cards). Theese cards are among the currently printed in CL and Reward edition.
That consideration leads us to an easy forecast: let’s assume a future moment where we are in a similar position of the macro market cycle and the printing period is ended. Thus, we have no more downward push of the buy cost from the inflation mechanism, while the bottom line for the rent price is already there. What will most likely occur is that the buy price will inflate around 10x to reclassify those cards among the once that are not printed anymore and with very low utility. While, the price inflation could be much greater if for those cards there will be any percieved utility.
The best chart to show this mechanism is the Reward edition chart, were most of the cards printed at the moment are around 100 PR, while all the others are at 1000 or above.
I know that this looks like reinventing the wheel, but theese are the first steps for the formalization of a mathematical tool, and it’s mandatory to test it against well known truths. In addition, this hypotesis gives us a specific number to look at to test the forecasts, so the time will speak.
A not so different consideration could be done for those cards that rule the charts, with PR values close to 100,000. If we remind that higher the rent price the lower the PR, we could argue that there is not huge demand for the rent, consequently the buy price is not reflective of the percieved ingame utility of the card itself. Thus, it is probably trained by an expectation for a future appreciation.
Differently by the case described for the currently printed cards, here we cannot be certain that the PR will come back to its class mean in the future, that will depend by many external events (change in meta, new use cases, enlargement of the player base, etc..). But we can say that, in average, a card with an extremely high PR is a riskier asset to buy or to hold if compared with one with an extremely low PR.
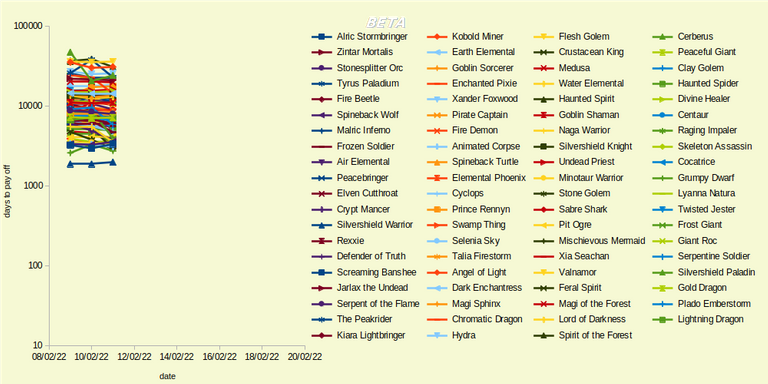
We can see some examples in the Beta edition detailed charts:
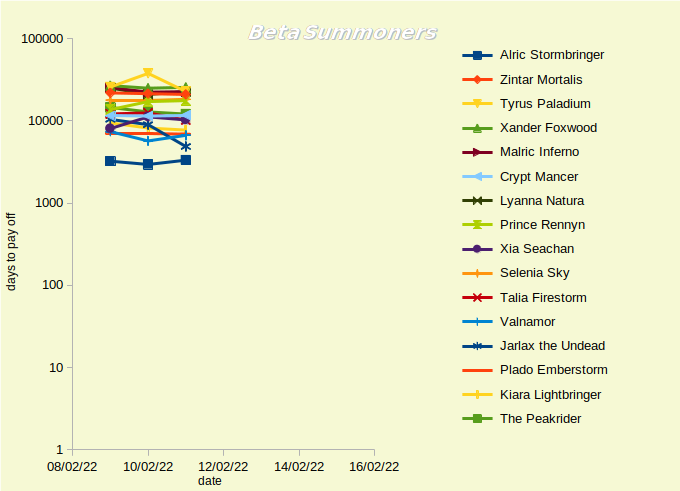
Here we have the summoners, down there we see the wonderful Alric Stormbringer, one of the most useful cards in the game, that beat the competition with the lower PR by at least a factor of 2, and that’s not because he’s cheap, he’s just a must have! We can see also Jarlax and Valnamor whom distinguish themselves for established nice usecases, but not enough to deserve a different class like Alric. On the top we see Tyrus, a good cards that pays the fact that he’s available for free in the starters deck, so less perceived utility for him.
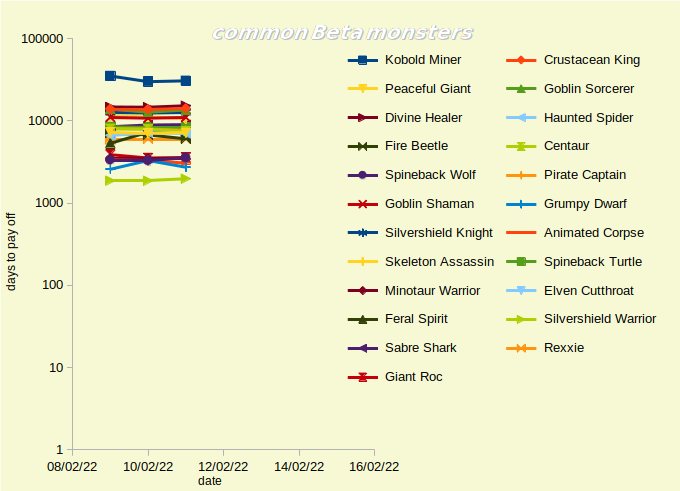
Among the commons we have two borderline cases. At the top we have the Kobold Miner, a very useful card, and at the bottom the silvershield warrior, a not so useful one. Here i need some help with the commentary because i could be biased by my own utility perception. Nonetheless i can try to interpret this upside-down situation: even if Bulldog did a video explaination about the uses of the kobold with tarsa, that message maybe has not reached yet the large new player group whom are in the demand side of the rent price, while it reached the more engaged community which are more likely holders of that card and see in it a future appreciation. While for the silvershield warrior, it could be that i don’t see its utility because i often avoid the life splinter.
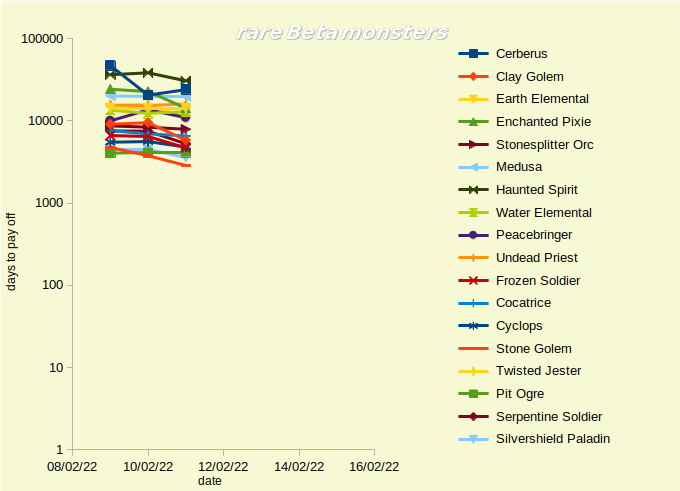
In the rare chart i see a clearer situation, a very dense group with the cerberus and the haunted spirit slightly higher. Here i feel more confident interpreting the data: after the CL launch we lost both cards from the basic deck, and both of them were meta in lower leagues. I, and many like me, immediately tried to rent or buy those cards, falsely certain that both of them would have kept theyr key role in the game (we can remind theyr spike in price few weeks ago). Nowadays i barely use them in the poison/earthquake matches, thus, they had a very quick demand collapse. It’s quite tipical that a lag time separate the demand collapse with the price collapse, i wouldn’t be surprised to see that the liquidity for the buy market of both cards is very low right now.
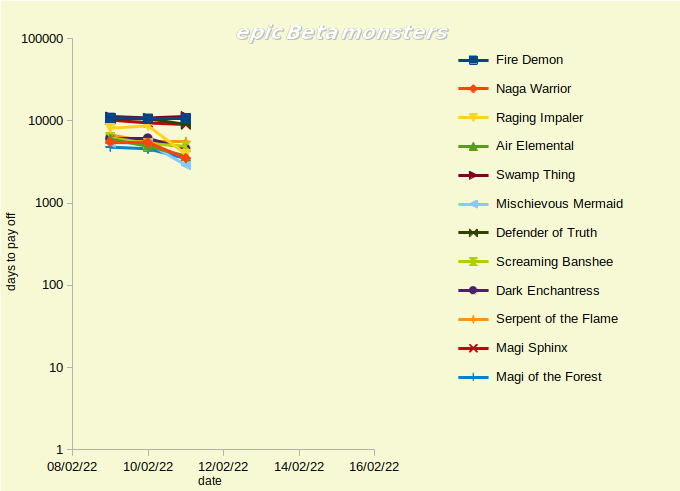
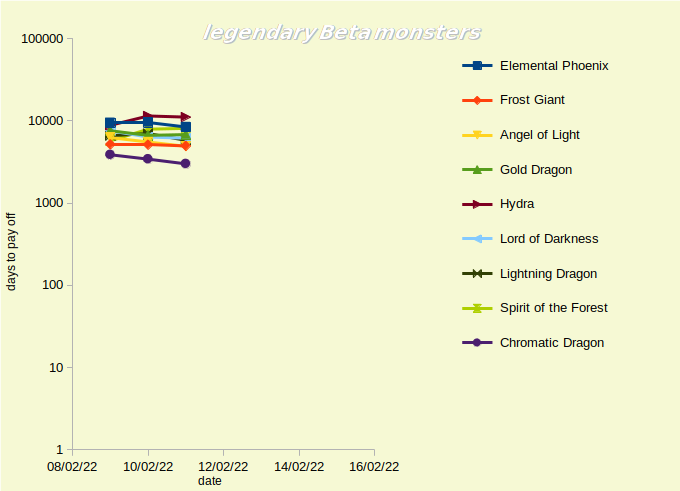
Epic and legendary charts are quite similar and all cards are very very close each other, exactly where one should expect the cards to be when they share common utility and appreciation potential.
Ok, if you are reading this, you are a hero! Thank you for making it till here.
What more can i say?
I showed a bunch of data took in a 3 days period, those data are not meaningful, not really. I wonder what kind of analysis one could make with data recorded for few market cycles. I believe that in the long run the cards will tend to converge to some well known PR values, accordingly to the intrinsic properties of the card itself (rarity, edition, etc) and the environmental properties (utility and forecasted utility), this race for the PR convergence will be continously disturbed by external forces (meta change, overall p2e trends, blockchain trends, etc). Imagine to dispose of a 3 or 4 years long chart, we could identify macro trends and forecast price changes with great confidence, using numbers to confirm or to challenge the intuition given by the expertise.
What do you think about that? To me it sounds plausible, but i definetly need a second or a third look into it.

Electronic-terrorism, voice to skull and neuro monitoring on Hive and Steem. You can ignore this, but your going to wish you didnt soon. This is happening whether you believe it or not. https://ecency.com/fyrstikken/@fairandbalanced/i-am-the-only-motherfucker-on-the-internet-pointing-to-a-direct-source-for-voice-to-skull-electronic-terrorism
I think this a great idea for tracking PR value, it would have helped me a lot along my Splinterlands journey. The charts themselves are a bit of a mess, with too much data overlapping. I think pulling only a handful of examples (like the top, bottom and a middle example) or registering the charts different would make them a lot easier to visually digest. I do enjoy your work though, keep it up.
Thank you so much for taking the time to read it and give feedback. I agree the charts definitely need major revisions. I will continue to follow the PR and in a couple of weeks I will provide an update with more effort to improve the readability and visive appealing
That's awesome Walter! Good job man. Love this data-driven approach and feel the PR metric you've defined is very interesting. It will be interesting to look at it over a longer period of time and with more data in order to remove some of the noise.
Congratulations @wlatt! You have completed the following achievement on the Hive blockchain and have been rewarded with new badge(s):
Your next target is to reach 100 upvotes.
You can view your badges on your board and compare yourself to others in the Ranking
If you no longer want to receive notifications, reply to this comment with the word
STOPCheck out the last post from @hivebuzz:
Support the HiveBuzz project. Vote for our proposal!