SPS 8 hour chart, Predictions of market flow
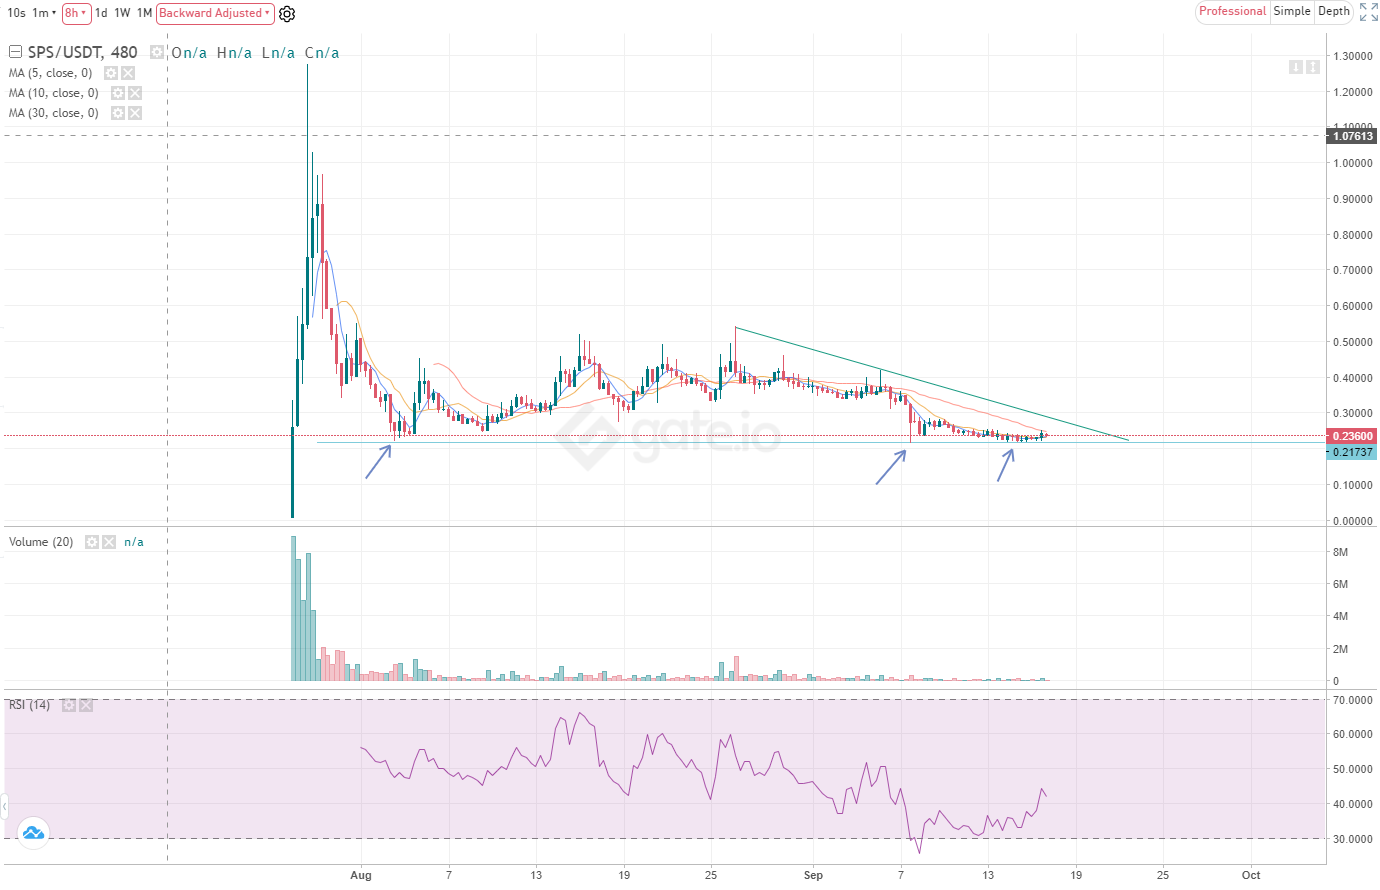
"Above is the chart of SPS vs USDT, taken on 1:35am 9/17/21 in PH"
*chart date: 7/27/21 to 9/17/21
lowest: 0.00710 (intorductory price)
highest: 1.27440 (highest peak on 7/28/21)
- after it reached to 1.27440 it went into a downtrend up to 0.22026 before it bounce
- highest it got after the downtrend is 0.54100 on 8/26/21
- it is still consolidating up to this time
- but check the arrows, that is the supporting price, possible lowest price to enter is around 0.21477 (lowest on 9/7/21) up to 0.22
- 0.21 to 0.22 is a great entry point
- through the consolidation period, a lot of people are already bidding on those prices to get into position
- also check the descending triangle, if that breaks, it would be good news to us who have SPS :)
- RSI (relative strength index) also indicates that SPS is already oversold so a lot of people are also getting in
- we might still have another week before we can see if it will break out or dip lower, but from the looks of it, volume shows that a lot of people are already gathering SPS between 0.21 to 0.22
- additionally, BTC and ETH are recovering
"Hope you enjoy the Chart study for SPS, and please note, this is just a speculation, we will never be able to truly predict the direction of the market"
Let's enjoy the game and expansion while we are waiting for the SPS :)
0
0
0.000
Electronic-terrorism, voice to skull and neuro monitoring on Hive and Steem. You can ignore this, but your going to wish you didnt soon. This is happening whether you believe it or not. https://ecency.com/fyrstikken/@fairandbalanced/i-am-the-only-motherfucker-on-the-internet-pointing-to-a-direct-source-for-voice-to-skull-electronic-terrorism