SE Charts: Splinterlands: SPT, DEC, ALPHA, BETA, UNTAMED[Feb20]
Comparing price performance of four Splinterlands token.
Starting point is 02.06.2019. The earliest time to get consistent prices data from all coins.
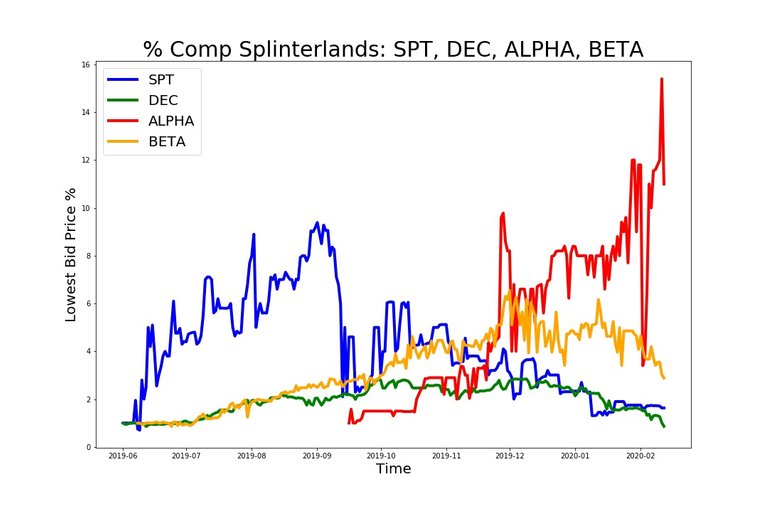
UNTAMED token excluded from comparison because reasonable data is only available starting 15.11.2019.
| Token | Price Performance [%] (1) | Median Token Volume (2) | Median Steem Volume (2) |
|---|---|---|---|
| SPT | 63.0 | 28139.0 | 105.0 |
| DEC | -13.8 | 1466550.0 | 8029.0 |
| ALPHA | 1000.0 | 6.0 | 99.0 |
| BETA | 188.7 | 45.0 | 424.0 |
(1) Price performance covers the period from 02.06.2019 to 12.02.2020.
(2) Median Volume for token and Steem covers the complete trading history.
Pairwise comparison of daily percentage changes
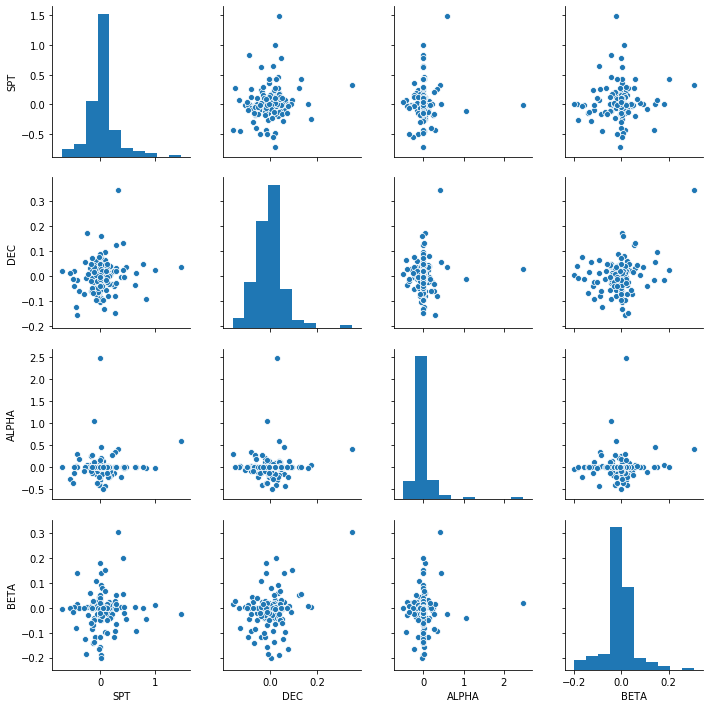
First derivative of token correlation coefficients:
| SPT | DEC | ALPHA | BETA | |
|---|---|---|---|---|
| SPT | 1.00 | 0.16 | 0.11 | 0.05 |
| DEC | 0.16 | 1.00 | 0.01 | 0.17 |
| ALPHA | 0.11 | 0.01 | 1.00 | 0.01 |
| BETA | 0.05 | 0.17 | 0.01 | 1.00 |
Coefficients range from -1 (inverse relationship) through 0 (no relationship) to + 1 (perfect correlation).
Check yourself before you wreck yourself
SPT works as the native token for https://splintertalk.io and https://monsters.tokenbb.io/. Staking enables upvoting of posts.
Unstake cooldown: 28 days.
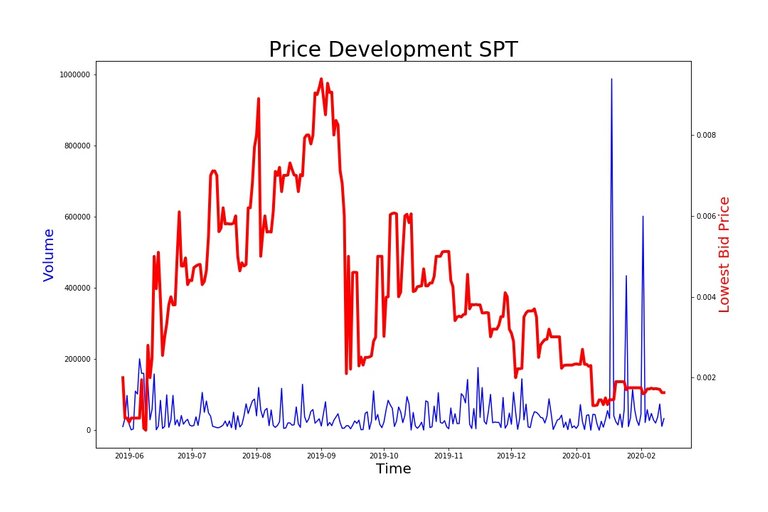
Left Y-Axis: Token Volume; Right Y-Axis: Steem/SPT
Start date: 29.05.2019
DEC - Dark Energy Crystals, the in-game currency token for Splinterlands
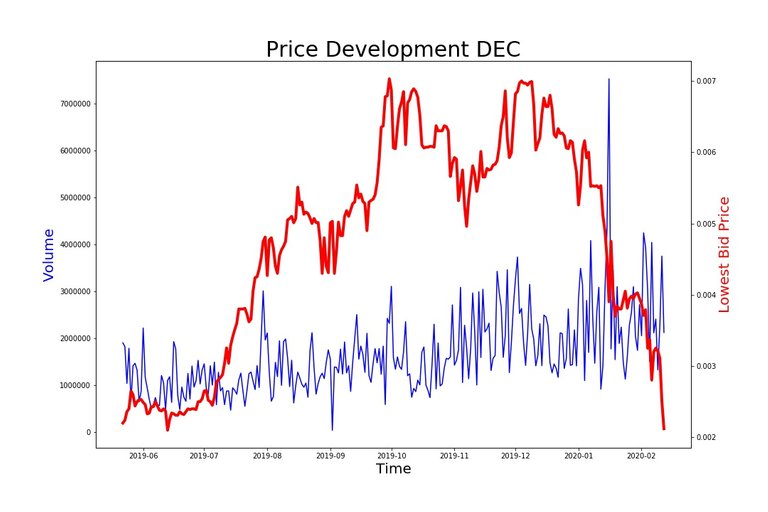
Left Y-Axis: Token Volume; Right Y-Axis: Steem/DEC
Start date: 22.05.2019
Data from 20.05. through 21.05.2019 omitted in chart to clean out launch period.
ALPHA token represent Steem Monsters Alpha Edition Booster Packs
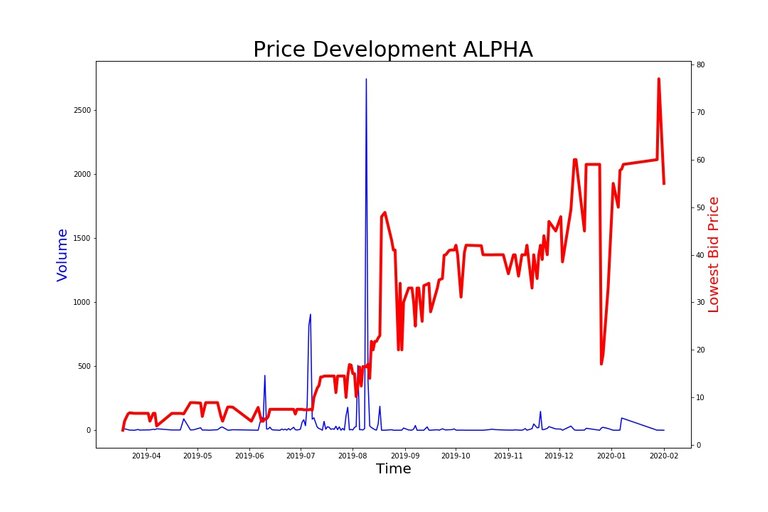
Left Y-Axis: Token Volume; Right Y-Axis: Steem/ALPHA
Start date: 18.03.2019
BETA token represent Splinterland Beta Edition Booster Packs
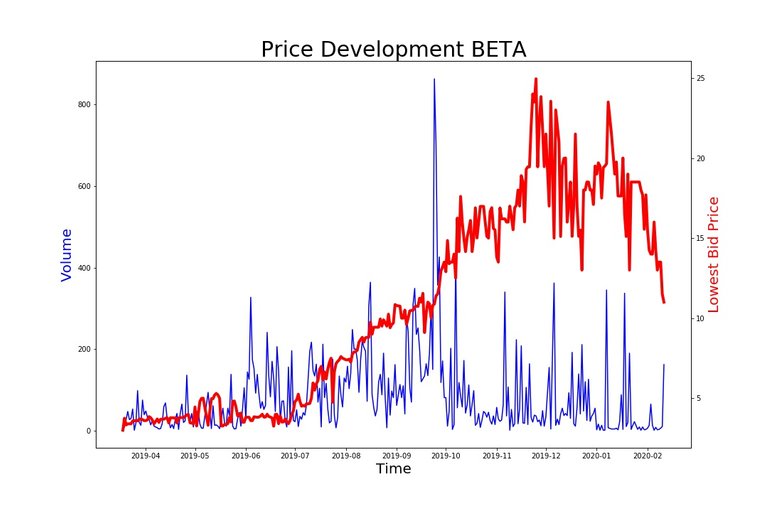
Left Y-Axis: Token Volume; Right Y-Axis: Steem/BETA
Start date: 18.03.2019
UNTAMED token represent Splinterlands Untamed Booster Packs
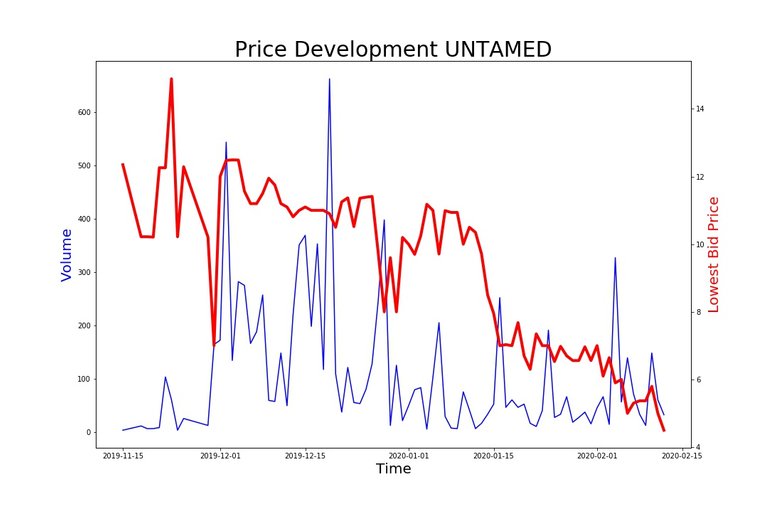
Left Y-Axis: Token Volume; Right Y-Axis: Steem/UNTAMED
Start date: 15.11.2019
Data from 12.10. through 14.11. 2019 omitted in chart because of negligible trading volume.
Price data is represented by daily lows in order to be conservative. Some tokens display a huge spread or sometimes don't trade at all. The daily low represents a bid where a transaction could happen.
Complete list of charts per month in chronological order:
SE Charts in Chronological Order [Jan 20]
SE Charts in Chronological Order [Dec 19]
SE Charts in Chronological Order [Nov 19]
SE Charts in Chronological Order [Oct19]
If you want to make some charts on your own:
Charting Ressources for SE Token
Disclaimer 1: Author may own discussed token at the time of writing.
Disclaimer 2: These charts do not constitute investment advice. Because why in the world would you take investment advice from a random account on the internet? What is wrong with you? Don't do that!
According to the Bible, Is the Bible final and complete? How does it support science? (Part 3 of 4)
(Sorry for sending this comment. We are not looking for our self profit, our intentions is to preach the words of God in any means possible.)
Comment what you understand of our Youtube Video to receive our full votes. We have 30,000 #SteemPower. It's our little way to Thank you, our beloved friend.
Check our Discord Chat
Join our Official Community: https://beta.steemit.com/trending/hive-182074
Hi @bluerobo, a free $trendotoken and !trendovoter to you from @Busbecq.
Thanks for playing the new TULIP Mania Game Round 3.
Also consider our MAPR fund and MAXUV vote bonds too.
MAP Steem Fintech: growing your STEEM without SP.
Congratulations @busbecq, you successfuly trended the post shared by @bluerobo!
@bluerobo will receive 5.47585313 TRDO & @busbecq will get 3.65056875 TRDO curation in 3 Days from Post Created Date!
"Call TRDO, Your Comment Worth Something!"
To view or trade TRDO go to steem-engine.com
Join TRDO Discord Channel or Join TRDO Web Site
Congratulations @busbecq, 4.88% upvote has been shared with your successful call on the post that shared by @bluerobo!
Support @trendotoken projects by delegating : 100SP , 200SP , 500SP , 1000SP , 2000SP
Congratulations @bluerobo, your post successfully recieved 5.47585313 TRDO from below listed TRENDO callers:
To view or trade TRDO go to steem-engine.com
Join TRDO Discord Channel or Join TRDO Web Site