Weekly Statistics For The $SPT Token
Hello friends of $SPT, Friends of $HIVE and all others,
here are the:
SPT Statistics for the last week:
The timeframe is from 2022/10/28 - 2022/11/04.
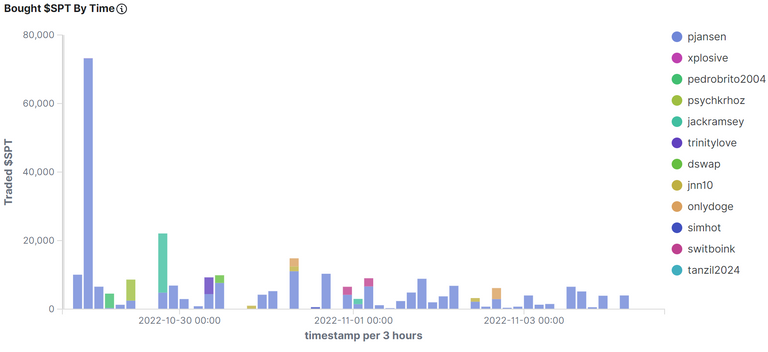
Bought $SPT By Time
This figure shows who has bought how many $SPT at which time:
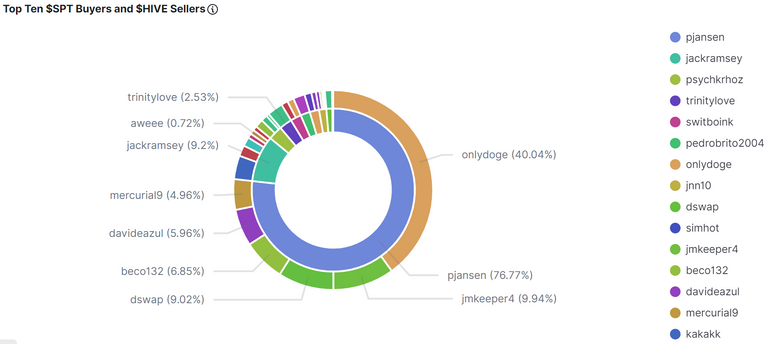
Top $SPT Buyers and $HIVE Sellers
The inside of the circle shows the buyers of $SPT, ordered by $HIVE they have spent. The outside shows the recipients of that $HIVE (sellers of $SPT):
Commulated Amount Of Bought $SPT Per Person
This figure shows the top 10 $SPT buyers, how much they got and how much $HIVE they spend for this. It is sorted by $HIVE, that was spent:
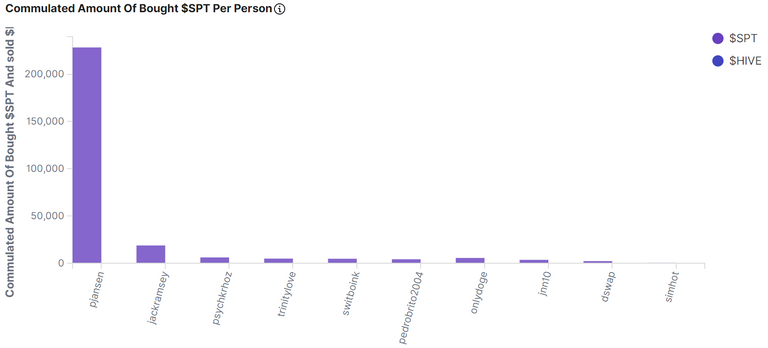
Table Of Top 20 $SPT Buyers
This table shows the top ten buyers of $SPT sorted by the $HIVE, they have spent:
| buyer.keyword: Descending | Sold $HIVE | Bought $SPT | Avg. Price |
|---|---|---|---|
| @pjansen | 115.18536871098159 | 228462.26135781858 | 0.0005041497605852783 |
| @jackramsey | 13.807850681245327 | 18786.959157943726 | 0.0007115945389324969 |
| @psychkrhoz | 4.251671365462244 | 6134.559276580811 | 0.0006944999913685024 |
| @trinitylove | 3.796041965484619 | 4872.9677734375 | 0.0007789999945089221 |
| @switboink | 3.2038580179214478 | 4727.23193359375 | 0.0006777450034860522 |
| @pedrobrito2004 | 2.8146698912605643 | 4201 | 0.0006699999794363976 |
| @onlydoge | 2.785871982574463 | 5564.118408203125 | 0.0004970999871147797 |
| @jnn10 | 2.1743580665643094 | 3556.478195440024 | 0.0006369990005623549 |
| @dswap | 1.74272882938385 | 2237.1357421875 | 0.0007789999945089221 |
| @simhot | 0.27504575718194246 | 580.1673965454102 | 0.00047408000682480633 |
| @xplosive | 0.02519958047196269 | 42 | 0.0005999900167807937 |
| @tanzil2024 | 0.004299730062484741 | 9.048445701599121 | 0.0004751899978145957 |
Commulated Amount Of Sold $SPT Per Person
This figure shows the top 10 $SPT Sellers, how much they sold and how much $HIVE they got for this, sorted by $HIVE:
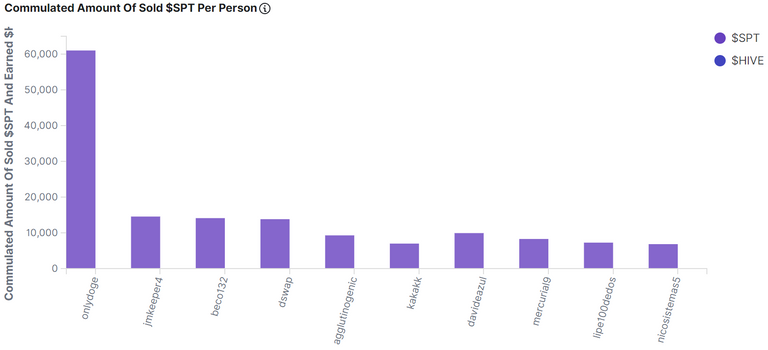
Table Of Top 20 $SPT Sellers
This table shows the top ten sellers of $SPT Sorted by the $HIVE, they have got:
| seller.keyword: Descending | Earned $HIVE | Sold $SPT | Avg. Price |
|---|---|---|---|
| @onlydoge | 33.27354757813737 | 61014.943115234375 | 0.0005915400222875177 |
| @jmkeeper4 | 7.858173847198486 | 14552.173828125 | 0.000539999979082495 |
| @beco132 | 7.415125072002411 | 14115.000061035156 | 0.000555708003230393 |
| @dswap | 7.29662651012768 | 13818.369719147682 | 0.0005065790901426226 |
| @agglutinogenic | 7.0829514265060425 | 9288.073486328125 | 0.0007556666581270596 |
| @kakakk | 5.499783039093018 | 6989.1767578125 | 0.0007868999964557588 |
| @davideazul | 4.714946746826172 | 9925.994140625 | 0.0004750099906232208 |
| @mercurial9 | 3.925046920776367 | 8279.466796875 | 0.0004740699951071292 |
| @lipe100dedos | 3.374524861574173 | 7258.4044189453125 | 0.00047251000069081783 |
| @nicosistemas5 | 3.167313575744629 | 6837.60107421875 | 0.0004632199998013675 |
| @david-lindsay | 3.1281514167785645 | 6601.146484375 | 0.00047388000530190766 |
| @gank | 2.9991421699523926 | 6349.749755859375 | 0.0004716849944088608 |
| @kraaaaa | 2.9047629833221436 | 4468.79736328125 | 0.00065001001348719 |
| @mango-juice | 2.8623293340206146 | 5719.148132324219 | 0.0005260200050543062 |
| @walkingkeys | 2.8395734418029406 | 4238.169479755685 | 0.0006699999794363976 |
| @crazyphantombr | 2.643997550010681 | 3901.139892578125 | 0.0006777499802410603 |
| @megamariano | 2.539824962615967 | 3567.169677734375 | 0.0007120000082068145 |
| @mightyrocklee | 2.499930167803541 | 5271.318434715271 | 0.0004743000026792288 |
| @switboink | 2.2750749588012695 | 4727.23193359375 | 0.00048126999172382057 |
| @wlffreitas | 2.2389683723449707 | 4649.6962890625 | 0.000481530005345121 |
| @other | 39.527169643155375 | 77601.15684582558 | 0.0005304734542733059 |
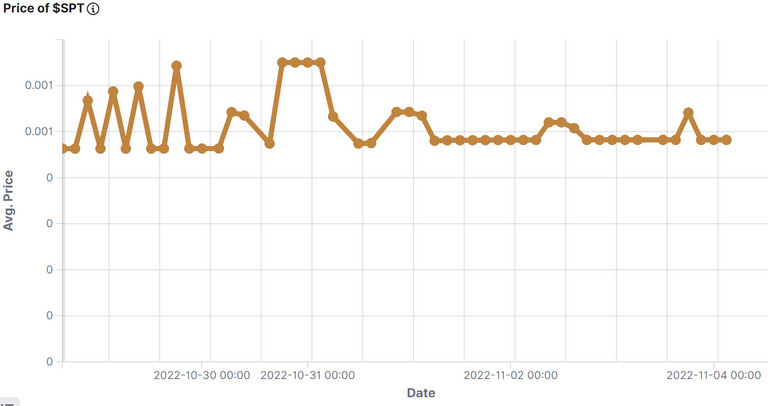
Price of the $SPT
This figure shows the price of $SPT for the last period:
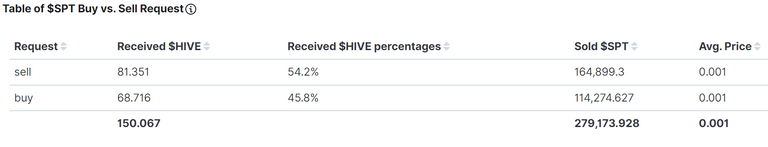
$SPT Summarize Metrics
This table shows how much $HIVE was given by buy-requests, that where equal or higher than the sell order vs. sell-requests, that were equal or lower than the buy order.
If the buy-requests where higher than the sell-requests, then money comes into the system and the value of the token increases.
Under the total line one can see the sum of $HIVE and sum of $SPT that changed the ownership and the average price of $SPT for the last period.
The average price of the token in the picture is wrong, actually it was: 0.001 $HIVE/$SPT
Comparison With Other Tokens
$HIVE/Token
This figure shows the value of $HIVE compared to some token for the last period. Be aware of the nonlinear (root square) y-axes.
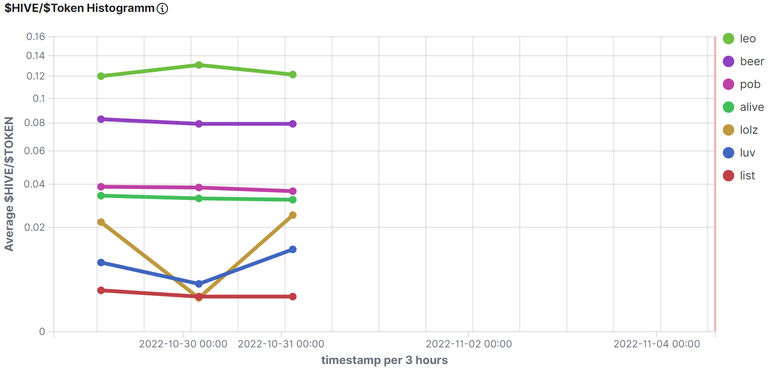
(Somehow I lost some data. I will check it later.)
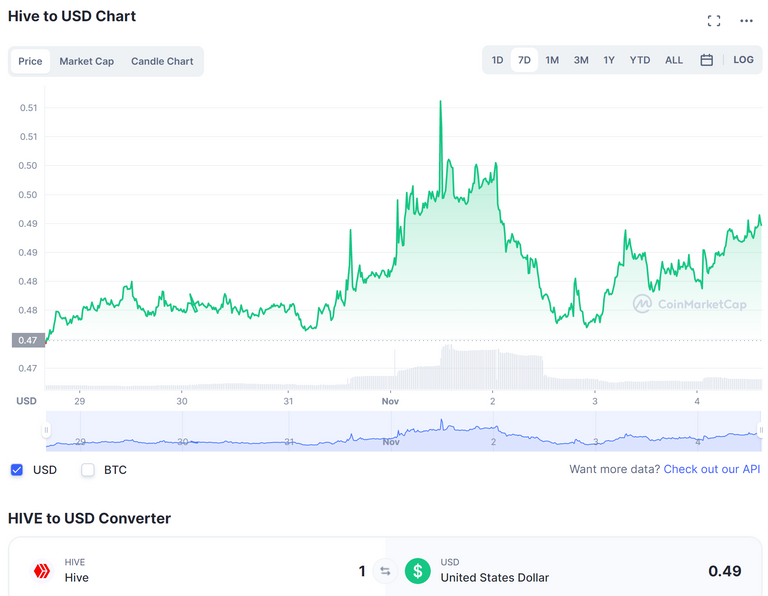
US-Dollar/Token
This figure shows the value of $USD compared to some token for the last period. Be aware of the nonlinear (root square) y-axes.
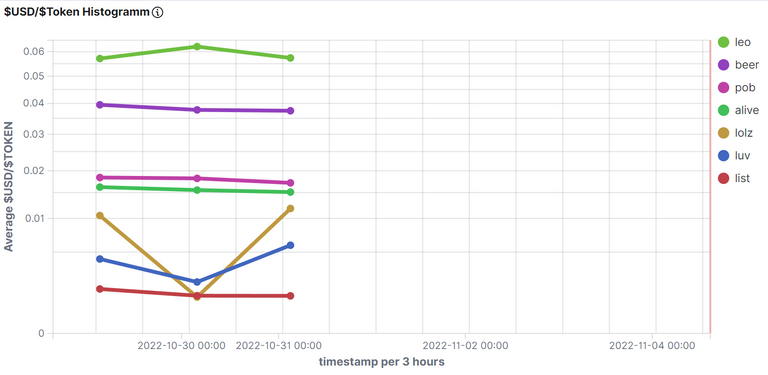
origin
Rank: 138
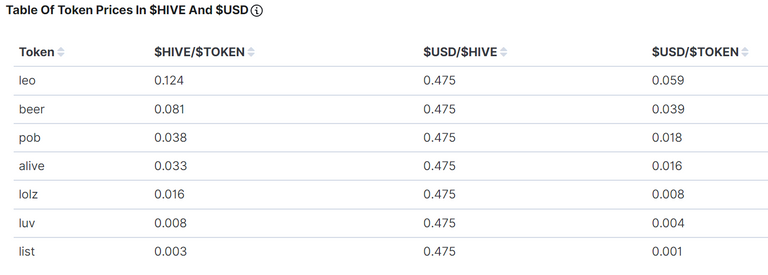
Table Of Token Prices in $HIVE and $USD
This table shows the average value of the prices of the token for the last period. One can see Hive and the US-Dollar compared to the token.
Disclaimer
All stats are without warranty.
They are taken from:
curl -XPOST -H "Content-type: application/json" -d '{ "jsonrpc": "2.0", "method": "find", "params": { "contract": "market", "table": "tradesHistory", "query": { "symbol": "SPT"}, "limit":1000, "offset": 0 }, "id": 1 }' 'https://api.hive-engine.com/rpc/contracts'
I have put them into logfiles and uploaded them to Kibana, from which I took the screenshots.
If you find errors, please tell me!
If you want me to continue the stats, give me some good upvotes ;-)
If you want to see other statistics (even from totaly other data), please contact me. I can create them weekly or monthly if I get some rewards for it.
For more details see here: How I Have Set Up Elasticsearch And Kibana On My Raspberry Pi To Monitor Token Activities and here: Do You Want To See Statistics Of Your Favorite HIVE Token? or on github.
Here are the stats from the other tokens I observe: https://peakd.com/@achimmertens/posts?filter=stats
Regards, Achim Mertens
Nice stats! I thought this was for SPS but it's SPT. What's SPT? So much has changed in a year!