SPS's going to Wave3? Target?
I try to use time frame 8 hr. for more information. And back to see behavior of this coin.......
information from GATE.IO
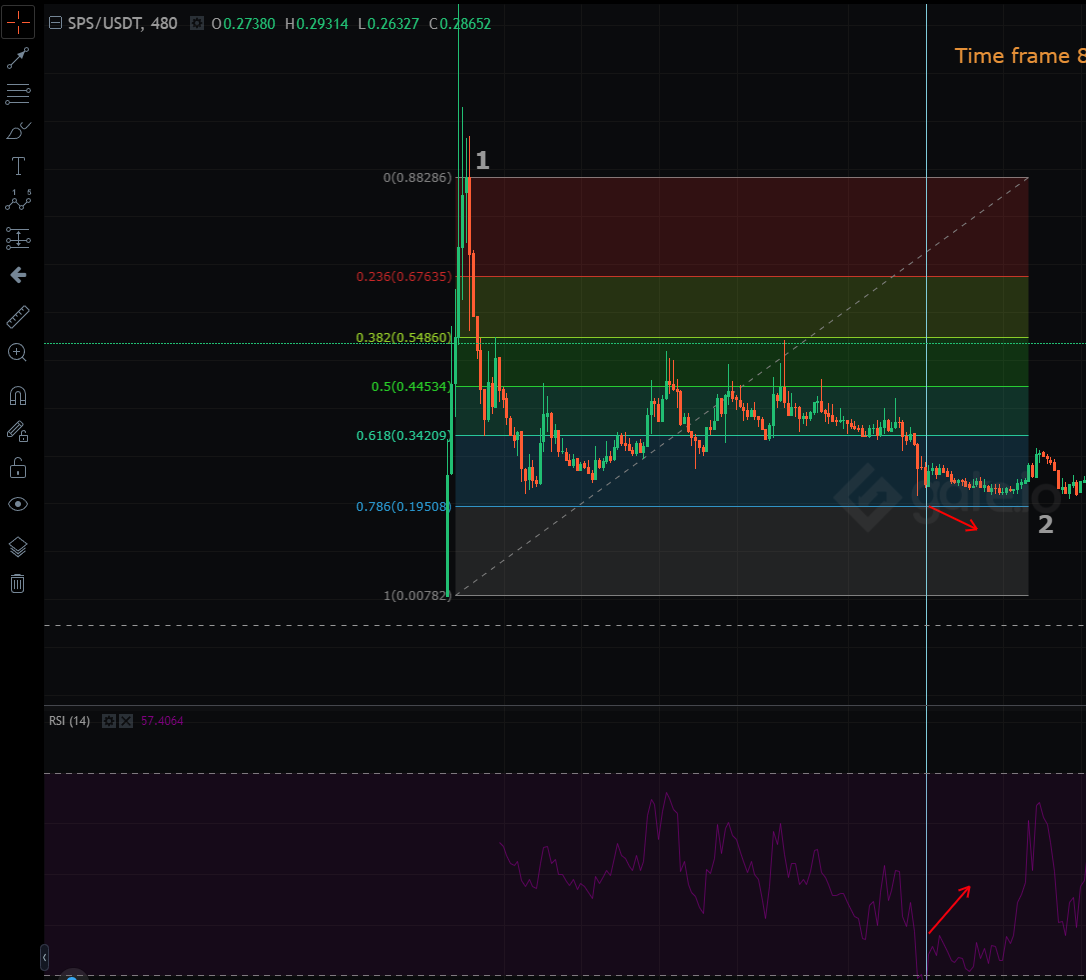
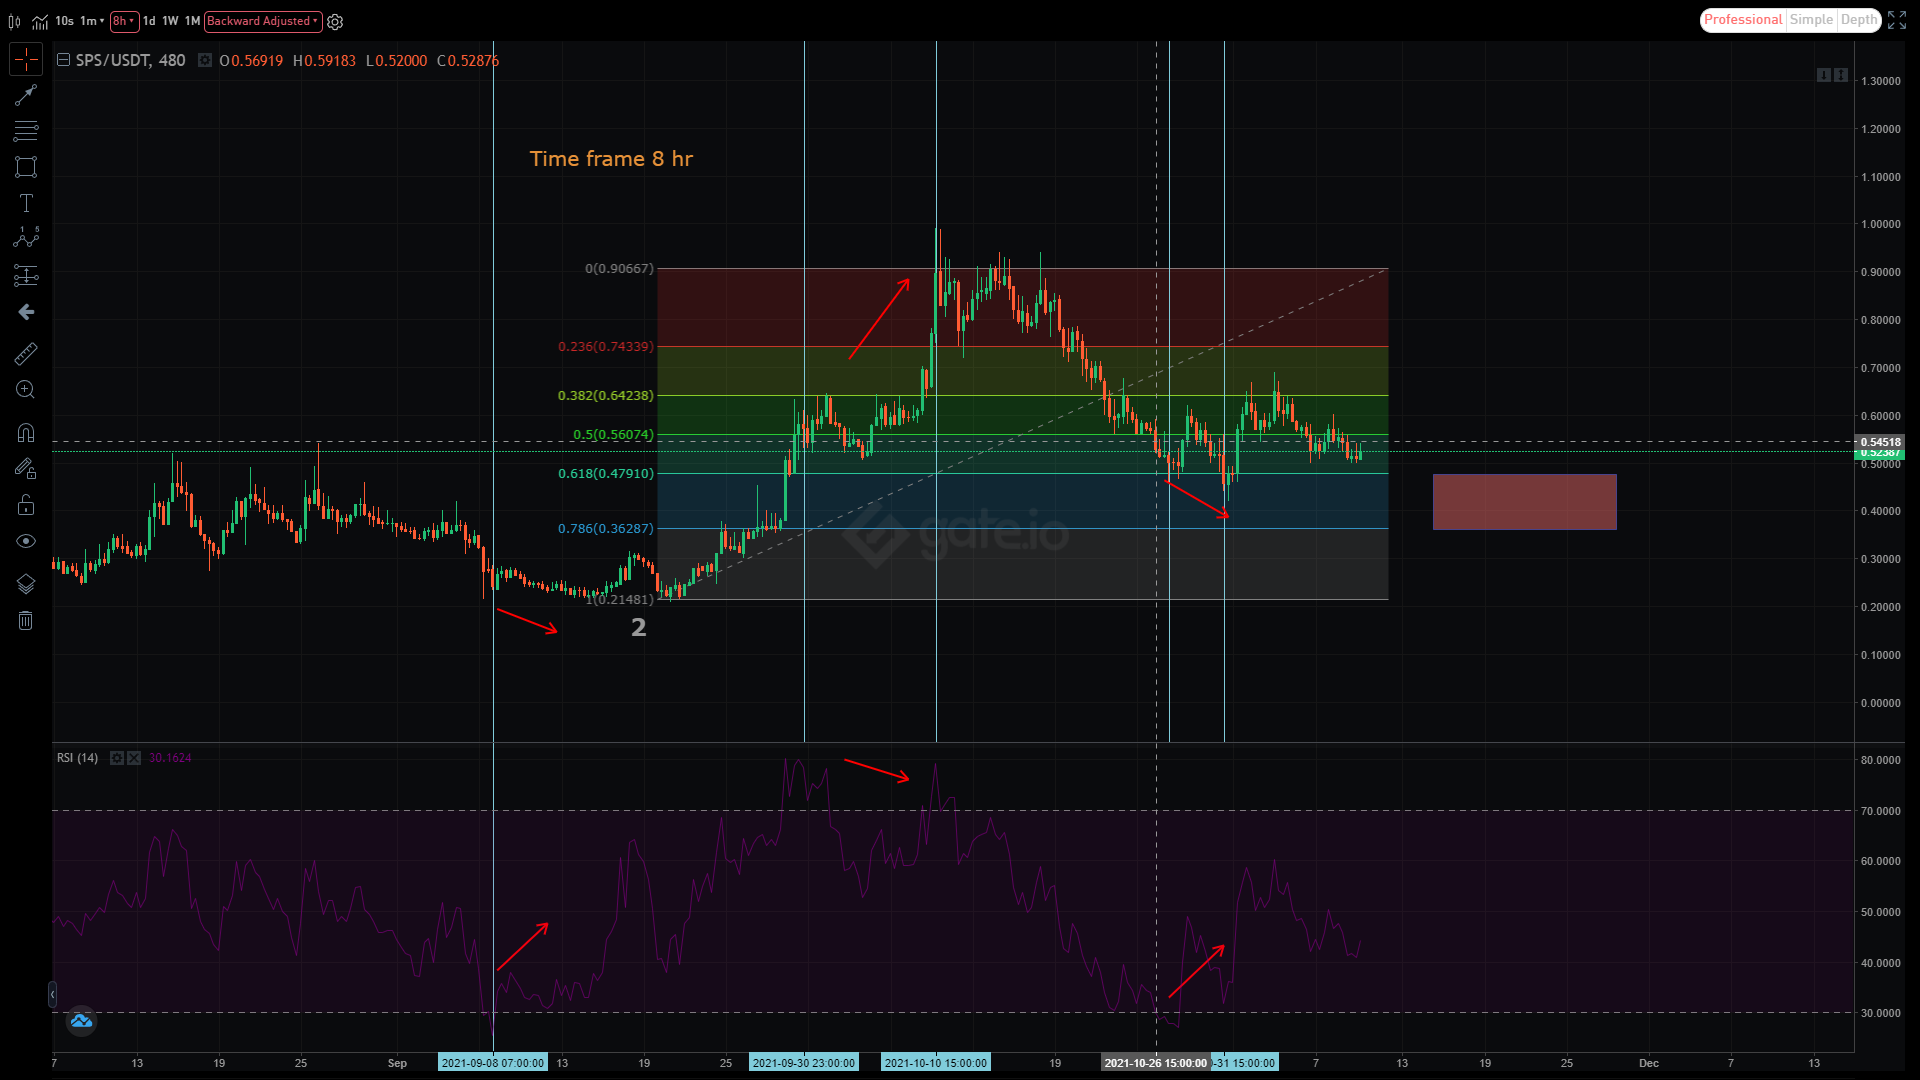
Trend reversal at point 2
- Fibonacci is in the Zone 61.8% -78.6%
- It clearly showed RSI Bullish divergence to Price
Let's Zoom in
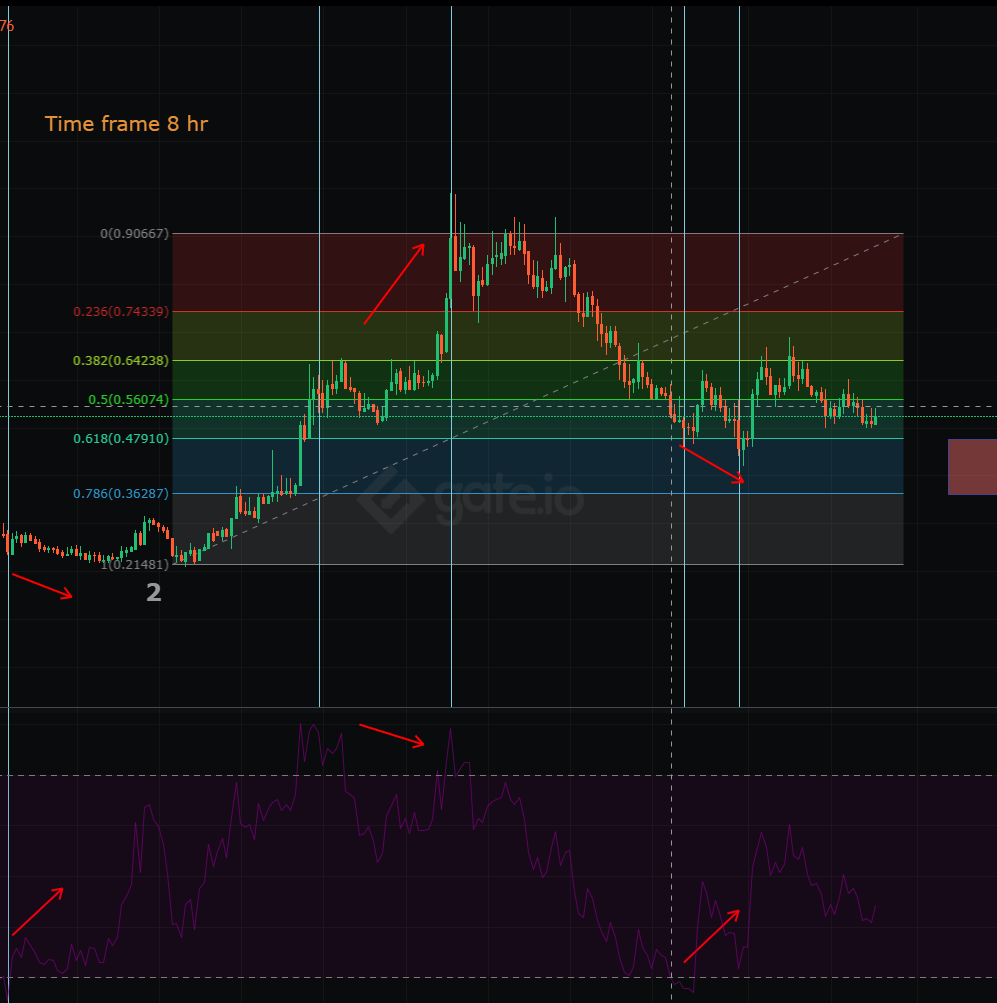
At the Top of $0.9 is clearly showed RSI Bearish Divergence to Price
Then Focus on present !!!!
AT the buttom about $0.36-$0.47 is also in the Zone of Fibonacci is in the Zone 61.8% - 78.6%
and the Sign of RSI Bullish divergence to Price is also noticed
It has 3 Possible way
1: Price back to Zone 61.8%-78.6% again $0.36-$0.47 If go through more than $0.36 should be consider to CUT loss and reanalyze...
2: Price back to Zone 61.8%-78.6% again $0.36-$0.47 before to Wave 3
3: It's alraedy Trend reversal go to Wave 3
What is the Target of Wave 3?
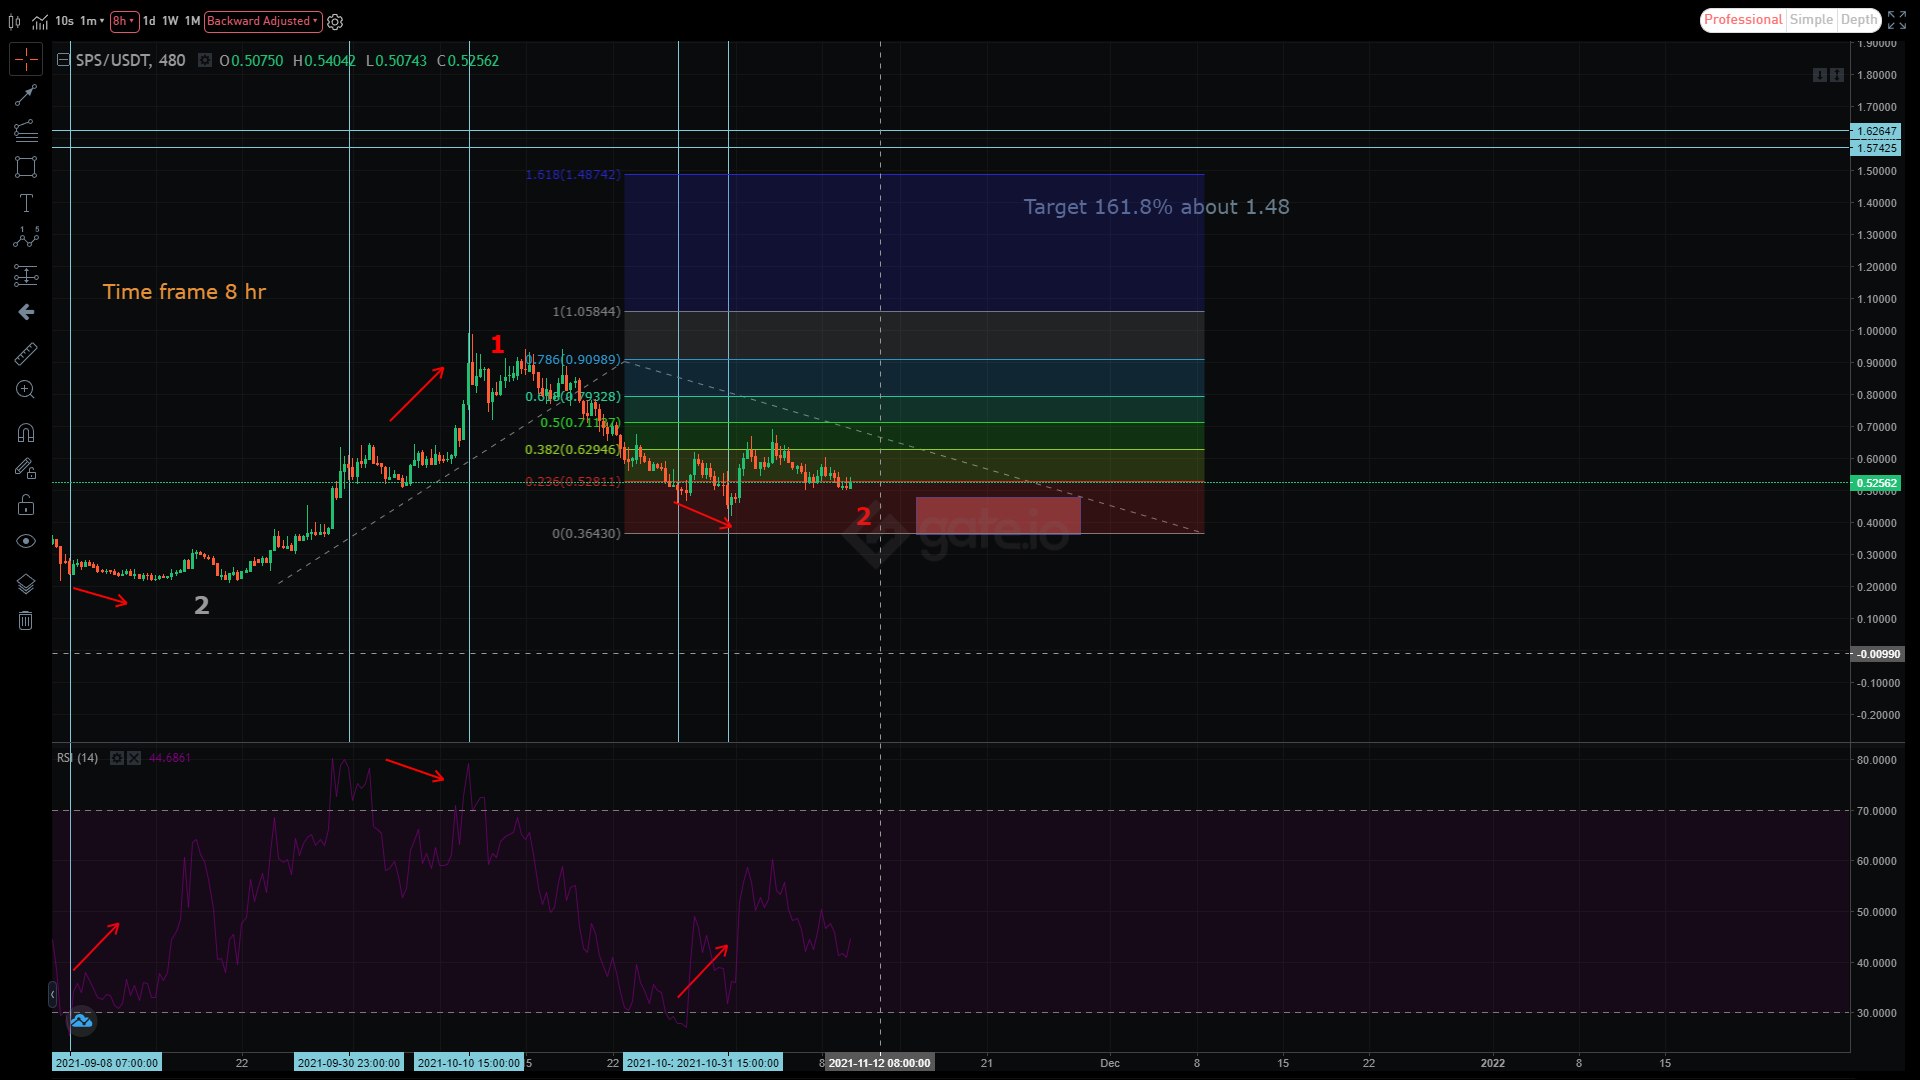
ZOOM In
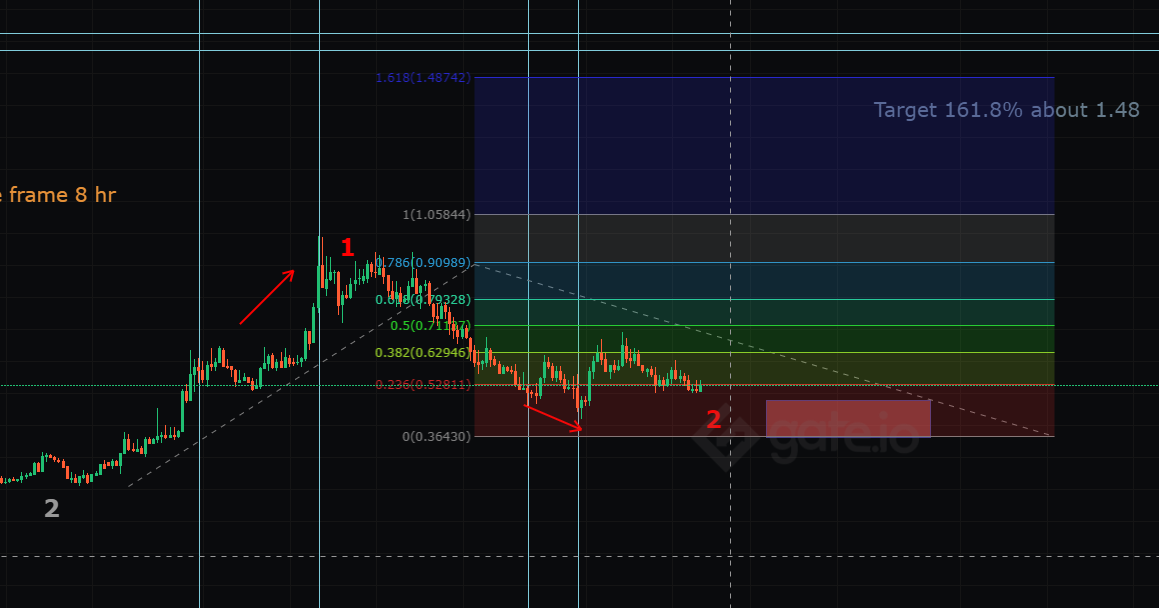
IF assume the reveral preice about $0.36 at 78.6% Fibo
.
.
The Possible Target price at 161.8% Fibo around $1.48 !!!
(I do believe that is the possible target soon.)
Notice: this only persernal openion.It is not for financial investment.
เยี่ยมเลยครับ เป็นกำลังใจให้ ทำออกมาอีกเรื่อยๆนะครับ
ขอบคุณมาก ๆ ครับ