Weekly Statistics For The $SPT Token
Hello friends of $SPT, Friends of $HIVE and all others,
here are the:
SPT Statistics for the last week:
The timeframe is from 2023/04/07 - 2023/04/14.
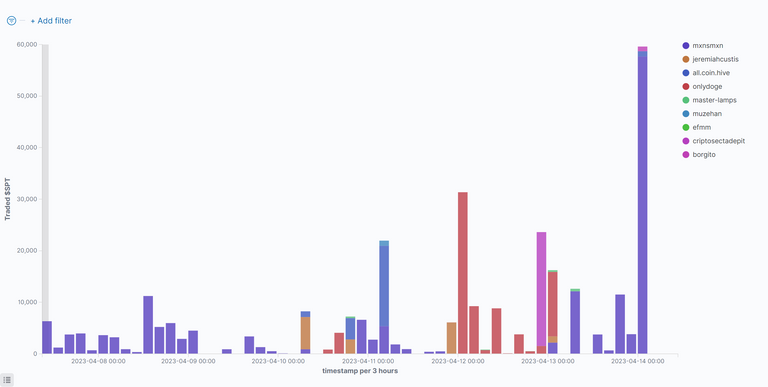
Bought $SPT By Time
This figure shows who has bought how many $SPT at which time:
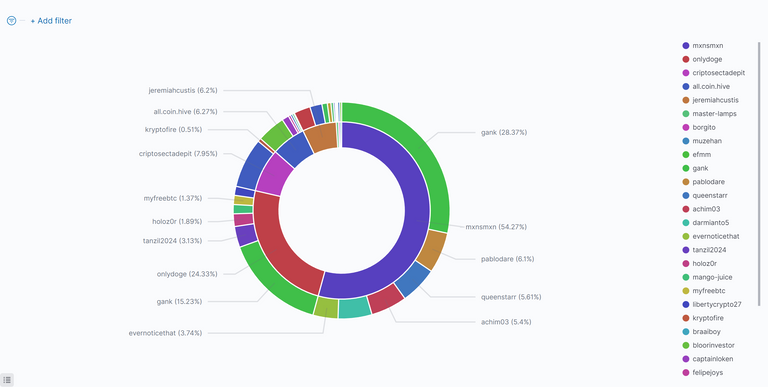
Top $SPT Buyers and $HIVE Sellers
The inside of the circle shows the buyers of $SPT, ordered by $HIVE they have spent. The outside shows the recipients of that $HIVE (sellers of $SPT):
Commulated Amount Of Bought $SPT Per Person
This figure shows the top 10 $SPT buyers, how much they got and how much $HIVE they spend for this. It is sorted by $HIVE, that was spent:
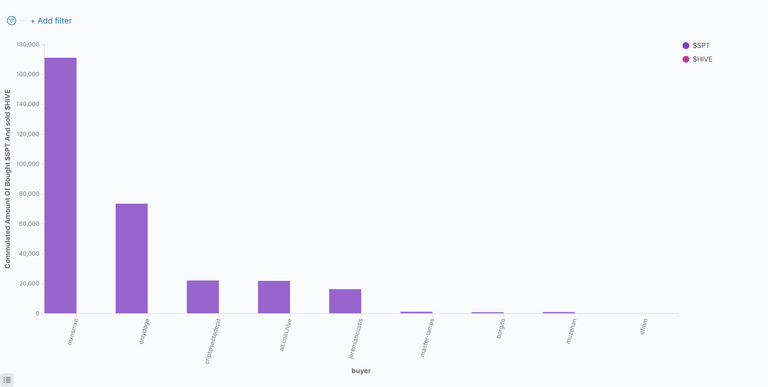
Table Of Top 20 $SPT Buyers
This table shows the top ten buyers of $SPT sorted by the $HIVE, they have spent:
| buyer.keyword: Descending | Sold $HIVE | Bought $SPT | Avg. Price |
|---|---|---|---|
| @mxnsmxn | 45.91351505523038 | 164818.9218213284 | 0.0002890173319125703 |
| @onlydoge | 21.43254373964919 | 73501.83017462492 | 0.0002915636463457662 |
| @criptosectadepit | 6.9999999500815875 | 22091.349033140577 | 0.00030070000017682713 |
| @all.coin.hive | 5.527703985571861 | 21843.883819580078 | 0.00027683166748223204 |
| @jeremiahcustis | 5.462057154983995 | 16296.35928240791 | 0.00032054778097921773 |
| @master-lamps | 0.3560763968016545 | 1226.8467372059822 | 0.00029391400166787205 |
| @borgito | 0.2581166923046112 | 905.672607421875 | 0.0002849999873433262 |
| @muzehan | 0.25 | 1000 | 0.0002500000118743628 |
| @efmm | 0.00583299994468689 | 20 | 0.00029165000887587667 |
Commulated Amount Of Sold $SPT Per Person
This figure shows the top 10 $SPT Sellers, how much they sold and how much $HIVE they got for this, sorted by $HIVE:
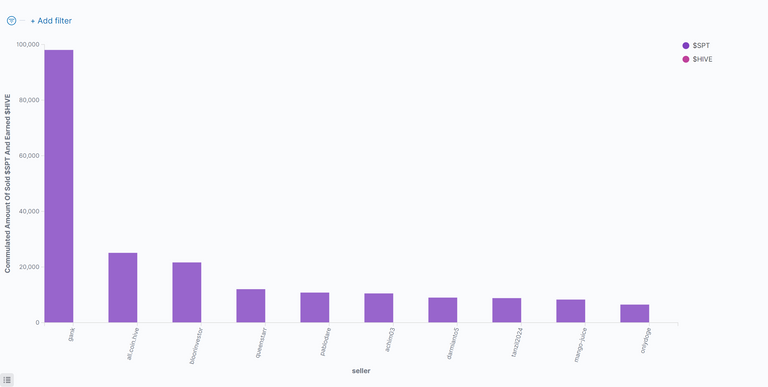
Table Of Top 20 $SPT Sellers
This table shows the top ten sellers of $SPT Sorted by the $HIVE, they have got:
| seller.keyword: Descending | Earned $HIVE | Sold $SPT | Avg. Price |
|---|---|---|---|
| @gank | 27.030504439026117 | 98038.75276184082 | 0.00028229999588802457 |
| @all.coin.hive | 8.109303966164589 | 25086.923919677734 | 0.00033381500543328 |
| @bloorinvestor | 5.448986172676086 | 21646.87890625 | 0.00025938666658475995 |
| @queenstarr | 3.37174528837204 | 12026.845336914062 | 0.0002775280037894845 |
| @pablodare | 3.0997636318206787 | 10804.464050292969 | 0.000286817507003434 |
| @achim03 | 2.744962453842163 | 10500 | 0.0002661749967955984 |
| @darmianto5 | 2.5712426900863647 | 8998.590942382812 | 0.00028574000073907274 |
| @tanzil2024 | 2.5695018768310547 | 8811.734375 | 0.000291600008495152 |
| @mango-juice | 2.4434623271226883 | 8290.159484863281 | 0.00029394666974743205 |
| @onlydoge | 2.120928466320038 | 6485.9564208984375 | 0.0003344650031067431 |
| @libertycrypto27 | 2.05272114276886 | 6994.100341796875 | 0.00029366000671871006 |
| @holoz0r | 1.5500527620315552 | 5315.681640625 | 0.000291600008495152 |
| @mawit07 | 1.3366025686264038 | 4580.873962402344 | 0.0002918100042734295 |
| @mightyrocklee | 1.272931206971407 | 4368.53902053833 | 0.00029055875711492263 |
| @kaibagt | 1.1649740934371948 | 4009.271728515625 | 0.00029056999483145773 |
| @dswap | 1.1468922835540365 | 3911.704284698302 | 0.0002837971447401547 |
| @myfreebtc | 1.1232538223266602 | 3853.62255859375 | 0.0002914800134021789 |
| @fwxiii | 1.1152784824371338 | 3780.733154296875 | 0.0002949899935629219 |
| @eijibr | 1.0764070749282837 | 3625.242919921875 | 0.0002969200140796602 |
| @captaincryptic | 1.0422728061676025 | 3659.794189453125 | 0.0002847900032065809 |
| @other | 13.814058419057005 | 46914.993476747535 | 0.00029358153269934135 |
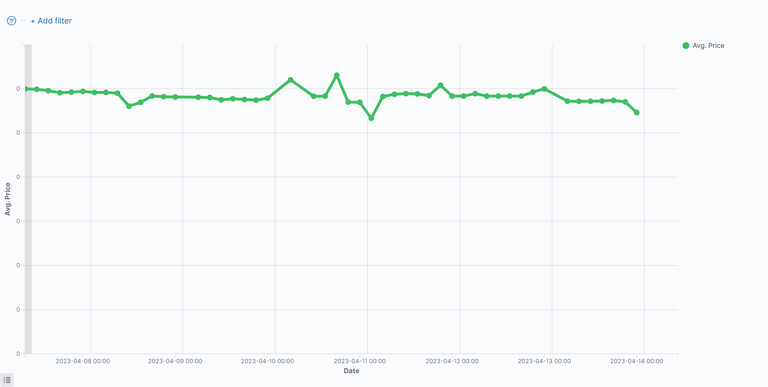
Price of the $SPT
This figure shows the price of $SPT for the last period:
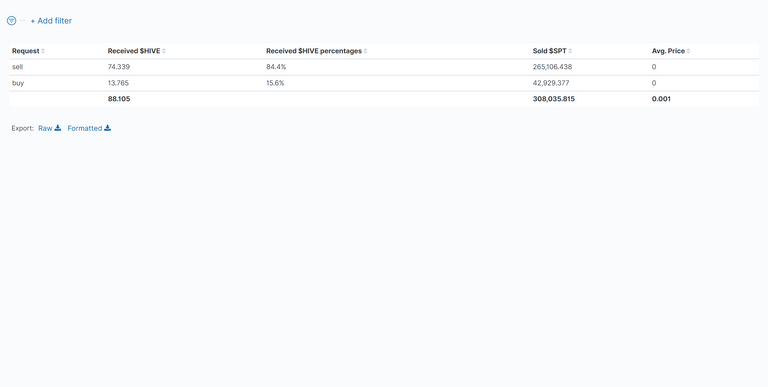
$SPT Summarize Metrics
This table shows how much $HIVE was given by buy-requests, that where equal or higher than the sell order vs. sell-requests, that were equal or lower than the buy order.
If the buy-requests where higher than the sell-requests, then money comes into the system and the value of the token increases.
Under the total line one can see the sum of $HIVE and sum of $SPT that changed the ownership and the average price of $SPT for the last period.
The average price of the token in the picture is wrong, actually it was: <0.001 $HIVE/$SPT
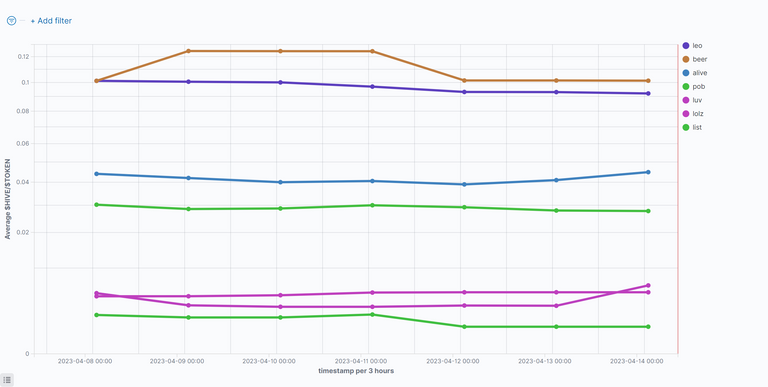
Comparison With Other Tokens
$HIVE/Token
This figure shows the value of $HIVE compared to some token for the last period. Be aware of the nonlinear (root square) y-axes.
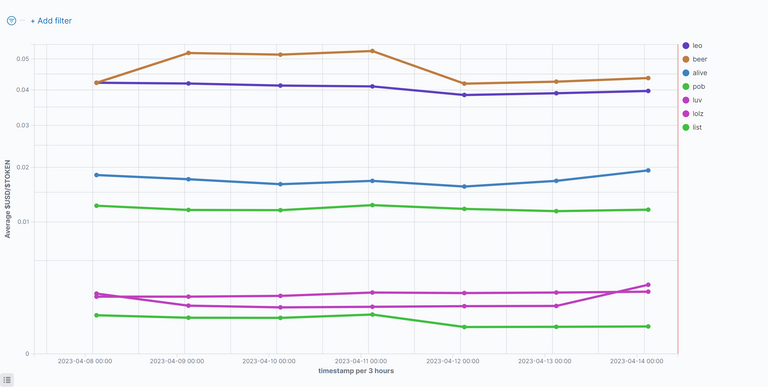
US-Dollar/Token
This figure shows the value of $USD compared to some token for the last period. Be aware of the nonlinear (root square) y-axes.
Rank 161
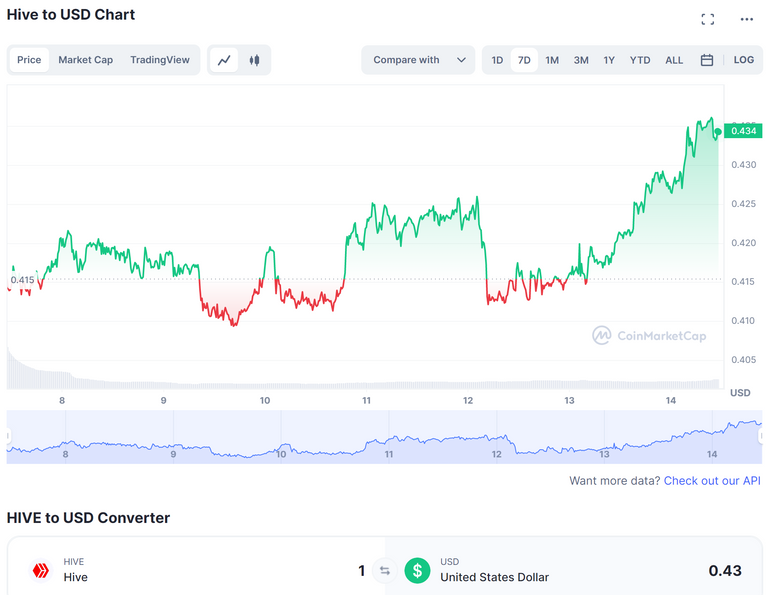
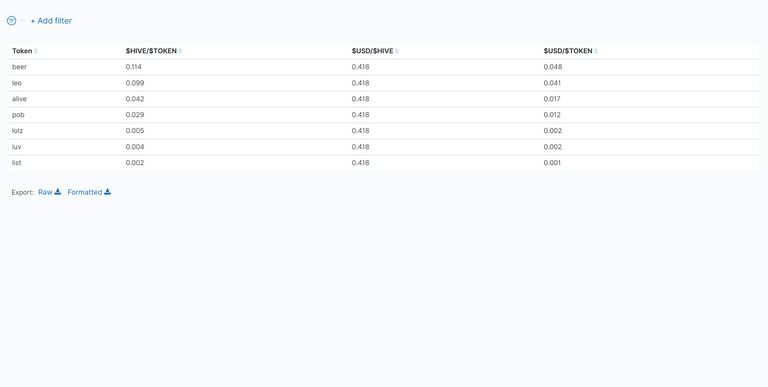
Table Of Token Prices in $HIVE and $USD
This table shows the average value of the prices of the token for the last period. One can see Hive and the US-Dollar compared to the token.
Disclaimer
All stats are without warranty.
They are taken from:
curl -XPOST -H "Content-type: application/json" -d '{ "jsonrpc": "2.0", "method": "find", "params": { "contract": "market", "table": "tradesHistory", "query": { "symbol": "SPT"}, "limit":1000, "offset": 0 }, "id": 1 }' 'https://api.hive-engine.com/rpc/contracts'
I have put them into logfiles and uploaded them to Kibana, from which I took the screenshots.
If you find errors, please tell me!
If you want me to continue the stats, give me some good upvotes ;-)
If you want to see other statistics (even from totaly other data), please contact me. I can create them weekly or monthly if I get some rewards for it.
For more details see here: How I Have Set Up Elasticsearch And Kibana On My Raspberry Pi To Monitor Token Activities and here: Do You Want To See Statistics Of Your Favorite HIVE Token? or on github.
Here are the stats from the other tokens I observe: https://peakd.com/@achimmertens/posts?filter=stats
Regards, Achim Mertens