The Splinterlands DEC Token Supply Continues to Contract! Data On Inflation, Burns and Supply | Aug 2023
The DEC tokens have been going through a maturity phase in Splinterlands. It was the first token that the game introduced, effectively incorporating the play to earn system back in 2019. The initial design was to provide an in-game token with a semi stable value and use it for trade and price in the game.
At the beginning the focus was on providing support for the token on the downside, because usually in game reward tokens tend to be sold from gamers. To achieve this Splinterlands uses a so called “product backed currency” where packs and otter in game assets are sold in fixed DEC price.
DEC was introduced in 2019 and it was a reward token that gamers received when playing and winning games. Later, in 2021, the SPS token was introduced, that made the price of DEC surge on the upside. There were no mechanics in place to limit the DEC price on the upside and DEC reached 10x the value it was designed to. Or its better to say that there were some mechanics in place (printing more when the price is higher), but this was not effective enough to peg the price on the upside. This was back in 2021.
Since then, more tweaks to the DEC tokenomics were introduced. DEC is now not a reward token in the game. It can be created at a fixed price when burning SPS for DEC. This gives it a lot more effective limit on the upper side. On the down side, more products and use cases are introduced, and in preparation for the land update that is expected to give DEC a lot more usability.
We will be looking at:
- Daily and monthly DEC created
- Daily and monthly DEC burned
- DEC created VS burnt
- DEC supply
- DEC price
Daily DEC Created
First for the amount of DEC created. Here is the chart for the daily data.
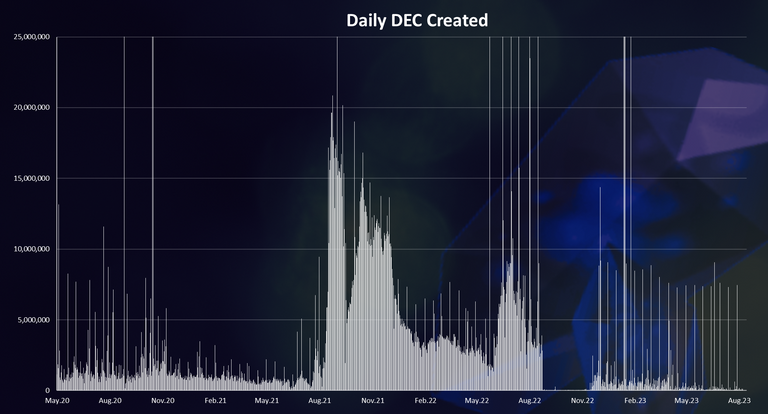
A lot of volatility for the DEC token emissions.
At first, back in 2020 and 2021, the daily emission was low to around 1M and bellow. But then in August 2021, things changed, as the SPS token was introduced and an overall bull market for the Splinterlands assets begun. This triggered more DEC to be printed and for some time there was more than 10M DEC printed daily, that was x10 or even x20 from the previous emissions. These numbers dropped going in 2022, but still in the first half of 2022 there was a significant amount of DEC printed daily, somewhere in the region of 3M to 5M.
The in August 2022, the game made a switch for the reward token, from DEC to SPS. Further emissions cuts were made in the following months, making the printing of new DEC tokens limited. It’s been a whole year in which the DEC emissions are significantly low.
The major way to create the DEC token now is with SPS burns. As the demand for the DEC token grows in game, we can see more SPS being burned for DEC.
Daily DEC Burned
DEC is burned for in game assets purchases and it is something that need to be taken into consideration. Here is the daily data.
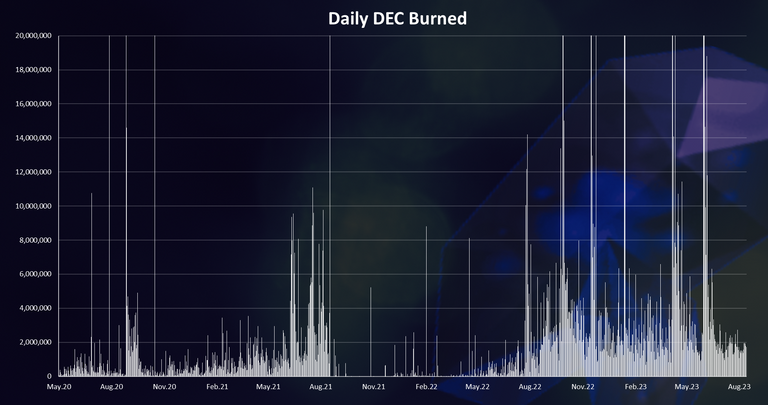
A regular DEC burns were happening up to August 2021, then a pause in the period up to August 2022, and a clear uptrend in the amount of DEC being burned in the last year.
Even more in the last period, when the daily burns are regularly above 1M and occasionally much more.
DEC Created VS Burned
When we put the created vs burned we have this:
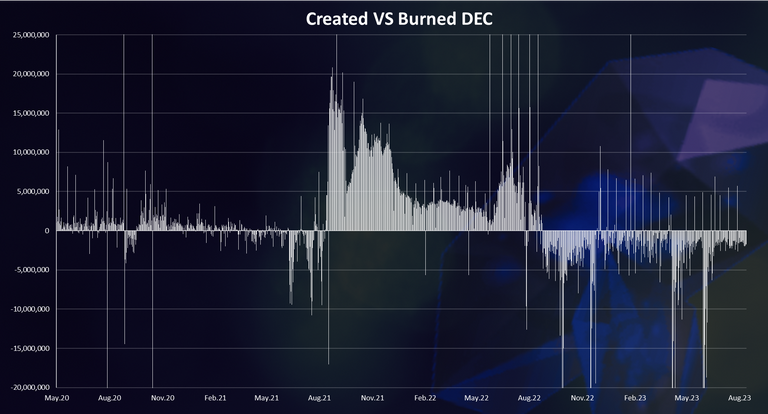
From the chart above we can differentiate three phases for the DEC token.
In the first phase from the creation back in 2019, up to august 2021, the amount of tokens issued and burned is relatively small. This is a period for maturing of the token. The second phase started in August 2021 and went on to August 2022. In this period a lot of DEC tokens were issued because of the bull market and the way the DEC tokenomics were designed. This is the expansionary phase. In the last period August 2022 to now, August 2023, the DEC token is in a contraction phase, where its excess supply is being removed.
Monthly DEC Created VS Burned
For a better representation here is the monthly chart for DEC created VS burned.
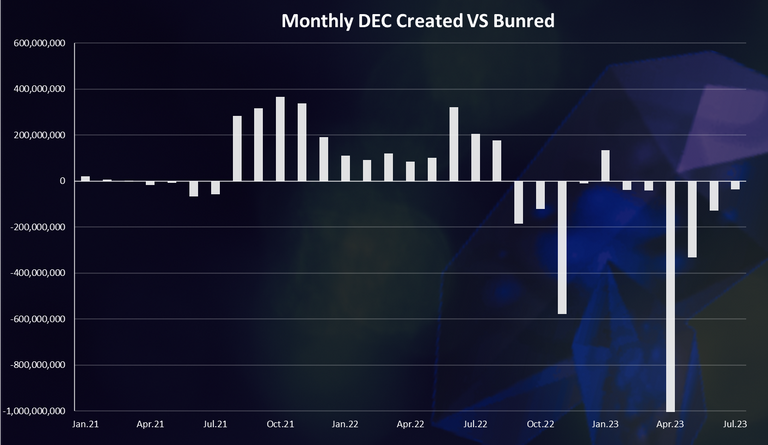
Here as well we can notice that in the last period more DEC is being burnt then created. After the expansion back in 2021, in the last 12 months, the DEC supply is going down. A large amount of the token was burnt just recently in April 2023. This usually happens when there are some promotional events for the token and users take advantage of it.
DEC Supply
Here is the chart for the DEC supply.
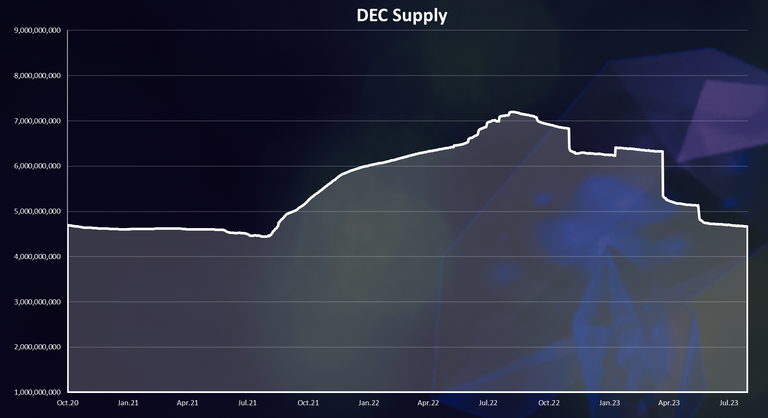
This chart probably shows the DEC supply in the best way.
We can notice the sharp drop in the DEC supply back in April 2023 when more than 1B was burned. Another drop in June with around 0.5B DEC burned.
The DEC supply was highest in August 2022, when there were around 7.2B tokens in circulation. Now there are 4.6B tokens in circulation, or cumulatively 2.6B tokens less. Going forward there should be even more use cases for DEC, more pressure on the price and hopefully more SPS burning.
When we plot this as a yearly inflation, this is the approximate data for the last three years.
| Year | DEC Inflation |
|---|---|
| 2021 | 29% |
| 2022 | 5% |
| 2023 | -26% |
Note that 2023 is not over yet. We can see that 2021 was the most inflationary for DEC, then a relatively small inflation in 2022 of 5%, and 2023 is negative -26% inflation for now.
Price
So, after all of this burning and use cases for DEC how is the price doing. Here is the chart.
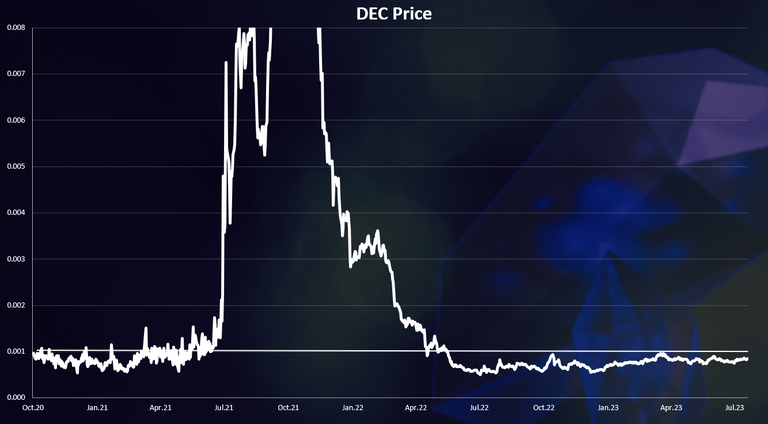
As mentioned previously, in the past DEC had inefficient mechanics to limit its price on the upside and because of this at the beginning of 2022 the token was trading above its peg of 0.001 USD. Then the SPS to DEC conversions were introduced and this is a lot more efficient design. On top of this, the overall market took a major downtrend in 2022, so the upper side of the token was no longer a problem. DEC broke its peg on the downside, trading at 0.0006 for a period of time, or at 40% discount, for a short period of time.
In the last year, we can clearly notice a trend for the DEC price slowly climbing to its peg. At the moment 1000 DEC tokens are trading for around 84 cents, or a 16% bellow its designed peg, but still higher then previously. With the deflationary supply in the last months, more use cases coming with land, the DEC token now seems positioned very well and with a good heath and stability ratio.
Disclaimer: All the data above is taken from Hive Engine and adjusted. There can sometimes be lags between the Hive Engine data and the in game data that represents the latest numbers.
What do you think? Will we see the price of DEC to its peg? Maybe even trading higher, causing more SPS to be burnt?
All the best
@dalz
It seems to be stabilizing but I don't think there is any need to be obsessed with parity. The important thing is the number of players and I think that has decreased a lot.
We are still paying for the hyper inflation of the bull market but the cool thing is it feels like and by these charts also looks like we are very close to that peg and just in time for land when things are going to really get heavy for DEC usage.
Reducing supply from 7.2 billion to 4.6 billion is very good. DEC price will be higher than peg, this trend will continue.
So much Dec getting burnt and the price keep going down
People typically quote from this source
https://splintercards.com/
Actual 4,662.25M
Is this an accurate number? Seems like your number is fairly close to this number but your chart looks a bit different, but that could be the scale issue. It is possible to plot a chart of DEC supply last 90 days, which is what the website provide. I like to do an independent validation, if that is possible.
I will provide you the entire file with the data tommorow ... now in bed :)
Here is the chart in a similar scale as the one you refer to, from May 1st, till now .... its the same
Here is data for the DEC supply starting from Jan 1, 2023:
Excellent. Data checks out :)
Thanks for sharing! - @azircon

Thanks for the information
At least, this is good for me to know as someone who wants to begin to play Splinterlands
As soon as we see the bull market we will see its coin prices go up and many people who have stopped playing it will start playing it again because the amount of money at the moment is very low. are becoming due to which people have stopped playing it. Thanks for sharing this great knowledge about dec.
Excellent data to draw conclusions about how things are going...
hey dalz, great post; recently some in the community asked why we have 25B in total supply as stated on the official website? Could you clarify that? Was 25B actually minted at some time and if so, where is all of that since circulating supply is now at around 4B?
Just seeing this now... from the first look it seems that there is a 21B in the null account on HE, basicly burned, but the sight seems to add those as well.