Does Splinterlands Drive the Price of Hive or Does Hive drive User Activity on Splinterlands?
Granger Causality
My latest hobby is to take different datasets in Hive and apply Granger Causality testing to see if one statistic leads the other. You can do this to determine if one statistic appears to "cause" another, although it is not a true measure of causality and more winks and nods towards the possibility of causality involved. For example I have examined the connection between the price of HBD and the price of Hive, which I hope to write further about in the future.
Splinterlands
Most readers familiar with Hive will also be familiar with Splinterlands, the largest game in the Hive ecosystem and responsible for the vast majority of transactions, most of the time. Splinterlands is a "play to earn" game - the game rewards you financially for playing, although that money itself must come from players who want to buy cards and play the game.
Since Hive and Splinterlands are so connected, one can imagine that increases in the price of Hive could drive interest in Splinterlands. But similarly, players of Splinterlands need Hive in order to create their accounts, and the use of the Hive network means the need for Hive Power, which drives demand for Hive. So which is it, do Splinterlands users drive the price of Hive or does Hive drive interest in Splinterlands?
Preparing the Data For Analysis
I will start with the data on active Splinterlands players per day, and the data on Hive price. I got the former using @hivesql searching for users who use custom_json transactions with types relating to Splinterlands. I got the latter by exporting price data from coingecko.com
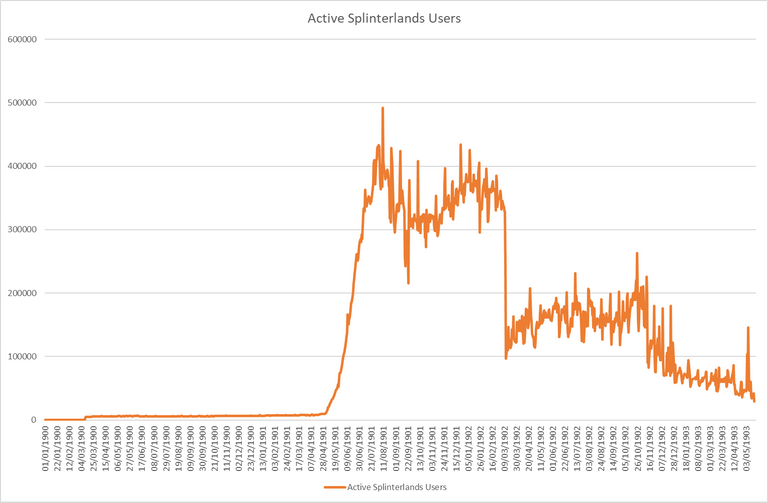
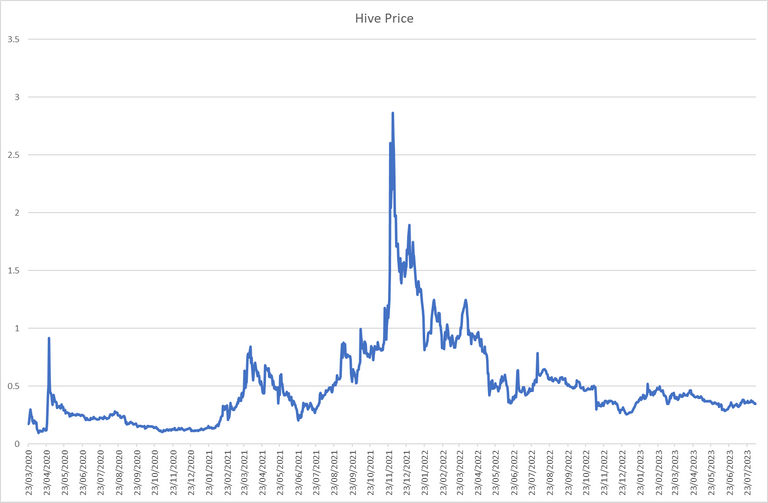
Looking at these charts, a problem is apparent. Granger causality tests can only be performed on data that has
- No Trend and
- No Seasonality
In statistics terms, the data must be "stationary".
It is immediately apparent that neither of these datasets are stationary, so we must make some effort to put the data in a format that is stationary. Instead of looking at active users per day and Hive price, we will instead look at the daily change in active users as well as the daily change in Hive price.
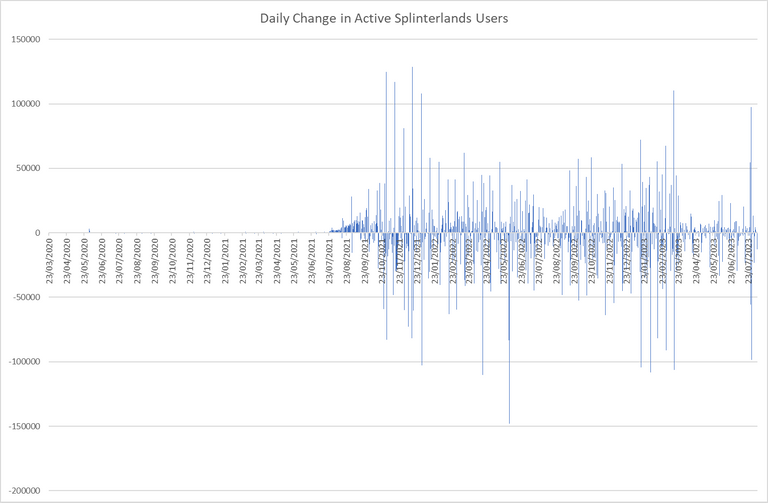
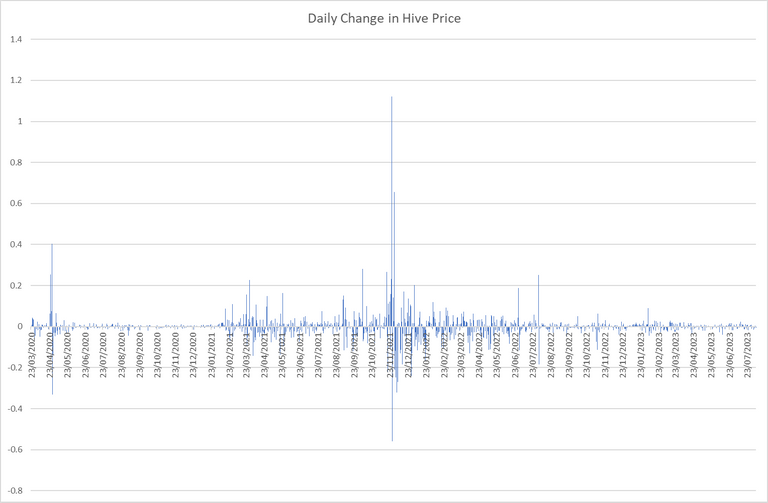
By eye, these two metrics appear to fit the concept of "stationary". To confirm it statistically, I run the Augmented Dickey-Fuller test. Here are the results, if you'd like to know more about how to perform this test and interpret the data, follow the link.
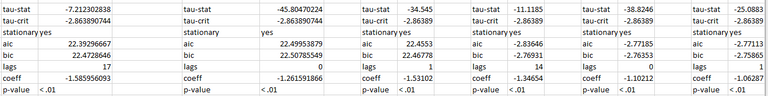
These tests confirm that the data is stationary, which allows us to proceed.
Granger Causality Tests
The Granger Causality test works by basically pushing each dataset back/forth by a set number of days. It then performs a regression test to see how well the data fit together. If pushing dataset A back by a few days improves the fit with dataset B, that implies that dataset A appears to "cause" changes in dataset B. Again, while not a true causality test, it hints at causality.
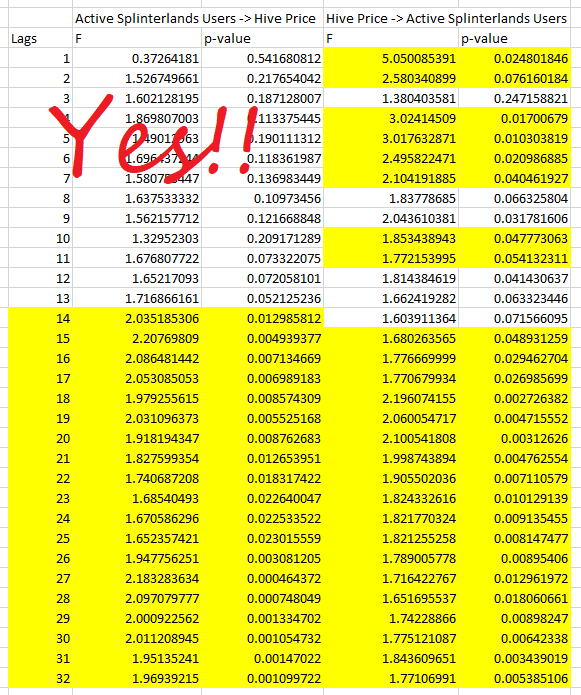
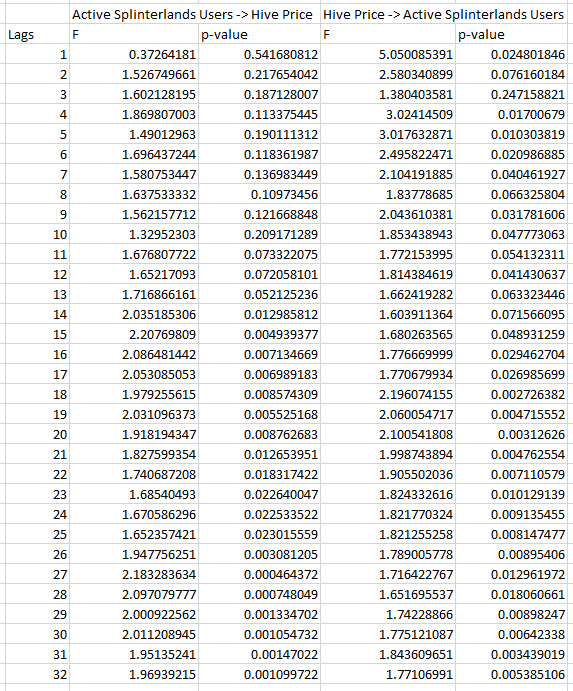
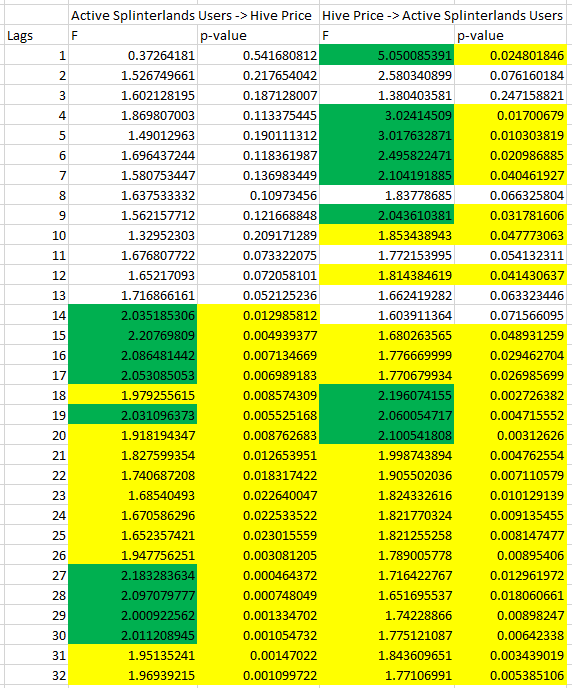
Here are the full results.
Interpretting the Data
Each day you move one of the datasets back is called a "lag". So for example, with lag 1 you have moved the set back 1 day. With lag 20, you have moved the set back 20 days.
We are testing both whether Splinterlands active users "cause" changes to the price of Hive, and also whether changes in the price of Hive "cause" changes to active Splinterlands users, so we have two columns of F and p-value for each test.
p-value is the first data point to consider. p-value means the likelihood that we could have made this finding by chance. By convention, the cut-off for a statistically significant result is 0.05 or less. Any p-value below 0.05 represents a statistically significant finding. I highlight all those which have statistical significance below. All findings other than these can be ignored.
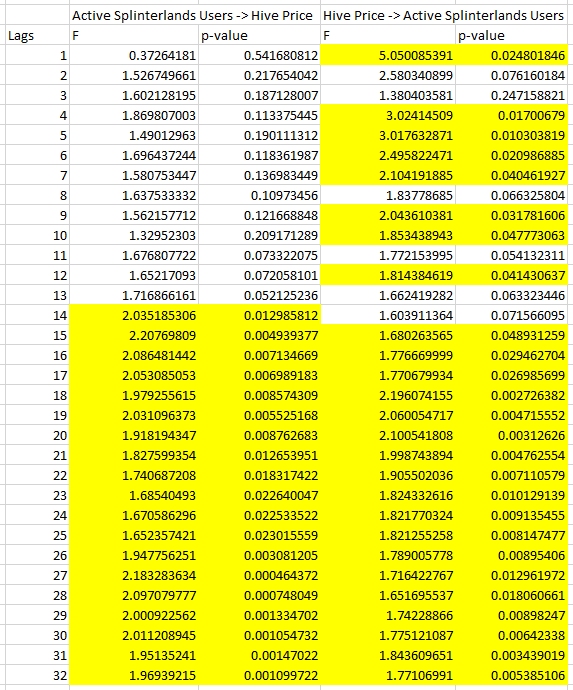
F can be thought of as the "strength" of the effect. The larger the F, the stronger the effect. I will highlight the strongest effects found in green below.
Conclusions
The price of Hive and the number of users active on Splinterlands both appear to have a causal impact on each other, but with different strengths of effect and different lag factors.
Hive price -> Splinterlands Active Users
When the price of Hive changes, we can expect an impact on the number of active Splinterlands players within 1 day. This is the strongest effect found in the data. The effect continues over the next few days, with strong, statistically significant effects found on days 1, 4, 5, 6, 7 and 9 after a Hive price change. The effect then continues for upwards of a month, but with weakening strength outside of days 18, 19 and 20 when the effect is strong again.
Splinterlands Active Users -> Hive Price
A change in user activity on Splinterlands has no statistically significant effect on the price of Hive for the first two weeks. After 2 weeks, a strong statistically significant effect is found. It can be said that the Hive price lags Splinterlands user activity by 2 weeks. That effect stronglycontinues for the third week, weakening slightly until the 5th week when it strengthens again.
My statistics and analysis posts take many hours each to research, chart and write. Indeed this post has been the longest to research yet, as I had to relearn a whole method of statistical analysis I had forgotten since University. If you find these posts valuable and of interest to other Hivers, I appreciate your support in sharing, commenting, and/or upvoting my work. If you're interested in these kinds of stats posts, click the 'follow' button on my profile, or subscribe to the Hive Statistics Community which features daily Hive stats posts from @arcange as well as less regular posts from myself and others.
Splinterlands and hive are directly propotional to each other.
This is a great one!
I'm a bit surprised by the fast reaction of SL players from the HIVE price, I guess the SPS price also moves with HIVE and that is a strong incetive. You can maybe look into the HIVE-SPS price corelation.
On the oposite side its intersting to see a two weeks lag and this is actualy a good info to try play with :) Also interesting that HIVE affects SL more than the oposite. I guess it is still a bigger ecosystem.
Yeah, it could very well be a secondary effect of Hive impacting SPS and/or related tokens and then SPS impacting Splinterlands activity.
This is nice
I guess Splinterlands and Hive have a way of working hand in hand
Let me say interwoven
Nice post!
Very nice analysis, it reminds me of the Vendors Analysis that I have done on data sets. Looking forward to more of your insights.
It's a fact that it's the biggest game on the hive ecosystem and the most people playing it, and when more people come to it, we'll see the price of corn go up. Price will appear and we will see because of this when a new user comes in he will also try to know all the things about him. It is a fact that when people start pouring money into a project, what happens to all things, we see their prices go up, same thing will happen here, both things will go up.
Great analysis and study. I don't often "rehive" posts, but this is incredibly worthy of that. Thanks for providing this. I learned about the analytical models you used while having it explained to me through concepts I'm familiar with.
Thanks again for the effort.
I love posts like these; hopefully I can create a study of my own. Definitely following! :)